4-Alarm Fire at Port of Benicia – video and report

Crews battling large fire at Benicia Port

ABC7 Bay Area News, April 9, 2022

BENICIA, Calif. (KGO) — A blaze at a Benicia port has grown to a four-alarm fire, officials said on Saturday.

The fire started just after noon at a dock along 1200 block of Bayshore Rd.

Most of the longshoremen working at the dock have been evacuated, officials said.

“Fire at Port of Benicia, a dock ramp is fully engulfed,” tweeted Cornell Barnard who is at the scene.

Officials say there is no shelter-in-place order but could change depending on the wind direction, but in a tweet, Benicia fire department says, “wind conditions are favorable…there continues to be no threat to the public.”

Benicia police are asking motorists to avoid the area due to “heavy police and fire presence.”

At a 4:30p.m. press conference, an official said no injuries have been reported.

COVID numbers low in Solano County, but keep that mask handy: 87 residents newly infected, 5 more in hospital

NOTE: The information below is not the latest.  TAP HERE for today’s latest information.

By Roger Straw, Thursday, April 7, 2022

Solano County’s Thursday report: 87 new COVID infections, 5 more in hospital.

Solano Public Health COVID dashboard, Thursday, April 7:

DEATHS:  Solano reported no new COVID-related deaths in today’s report.  No deaths reported so far in April.  COMPARE: 17 COVID deaths were reported in March, 15 in February.  A total of 413 Solano residents have now died of COVID or COVID-related causes over the course of the pandemic.

TRANSMISSION RATE: With today’s report, Solano remained in the desired MODERATE transmission rate, with 155 new cases in the last 7 days, down from 175 on Monday.  CDC FORMULA: Based on Solano County’s population, 450 or more cases in 7 days places Solano in the CDC’s population-based definition of a HIGH transmission rate.  Below 225 cases in 7 days shows MODERATE community transmission.  Numbers between 225 and 450 are considered SUBSTANTIAL transmission.

ACTIVE CASES: Solano reported 220 ACTIVE cases today, up from 177 at last report.

CASES BY CITY – Thursday, April 7, 2022:

  • BENICIA added 7 new cases today, total of 3,145 cases since the outbreak began.  TRANSMISSION RATE: Benicia’s 7-day case count is 10 as of today’s report, remaining in the CDC’s MODERATE range.  Benicia has bounced between MODERATE and SUBSTANTIAL range since mid-March.  For a city with Benicia’s population, anything over 27 cases in 7 days is considered HIGH TRANSMISSION.  14 to 27 cases is considered SUBSTANTIAL.  Below 14 is rated MODERATE.
  • Dixon added 1 new case today, total of 4,347 cases.
  • Fairfield added 31 new cases today, total of 22,698 cases.
  • Rio Vista added 1 new case today, total of 1,192 cases.
  • Suisun City added 4 new cases today, total of 5,955 cases.
  • Vacaville added 19 new cases today, a total of 21,669 cases.
  • Vallejo added 26 new cases today, a total of 25,546 cases.
  • Unincorporated added 0 new cases today, a total of 199 cases.
CA.GOV – COVID-19: California Case Statistics

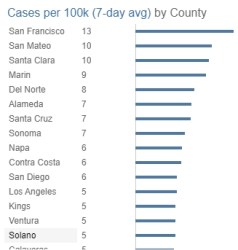
CASES PER 100,000, 7-day avg: My thanks to a BenIndy reader who asked about Solano Case Rates per 100,000 population. Solano doesn’t report Countywide cases per 100,000, but the Dashboard does show this data by City (see below).  The state of California posts County data and shows Solano at only 5 per 100K on April 4 (see at right).  It’s a hopeful sign for us at this stage.  But personally, I’m anticipating a BA.2 variant surge – and I’m still being VERY careful in public places.

Cases per 100,000 in Solano cities – Tap the image for full screen view.

TEST RATE:  Solano County’s 7-Day Percent Positive TEST RATE was back up to 4% today, from 3% on Monday. Even at this low rate, Solano does not compare favorably: The CALIFORNIA 7-day % positive rate rose from 1.2% to 1.6% today  [Source: Johns Hopkins Coronavirus Tracking Center] and the U.S. 7-day % positive rate was also up today from 2.8% to 3.0%. [Source: CDC COVID Data Tracker.] 

HOSPITALIZATIONS:

CURRENT: Solano reported the number of those currently hospitalized with COVID in the County rose today from 5 persons to 7. Current hospitalizations don’t tell the whole story, though, as this number reflects both admissions and discharges.  Only from the increase in total hospitalizations (below) can we know how many new admissions have come into our hospitals as of this date.

TOTAL hospitalizations: Solano updated its Age Group and Race/Ethnicity charts today, adding 5 new hospitalizations, for a pandemic total of 4,342 (see below – the County’s hospitalization numbers for Race/Ethnicity is less accurate, but presented here to show relative percentages).  TREND: Solano reported 284 hospitalizations in January, 184 in February, and (without explanation) 644 in March.  Only today’s 5 so far in April.

ICU Bed Availability Solano County reported available hospital beds increased today, from only 28% on Monday to 40% today, back in the County’s GREEN safe zone after a one day drop into the YELLOW danger zone.

Ventilator Availability in Solano County remained steady today at 73% available, in the County’s GREEN safe zone. 


HOW DOES TODAY’S REPORT COMPARE?  See recent reports and others going back to April 20, 2020 in my ARCHIVE of daily Solano COVID updates (an excel spreadsheet).

Click green text above or on the image.

>The data on this page is from the Solano County COVID-19 Dashboard.  The Dashboard is full of much more information and (as of 3/14/2022) is updated Monday and Thursday between 4 and 6pm.  On the County’s dashboard, you can hover a mouse or click on an item for more information.  Note the tabs at top for “Summary, Demographics” and “Vaccines.”  Click here to go to today’s Solano County Dashboard.

See also my BENINDY ARCHIVE of daily Solano COVID updates (an excel spreadsheet).  I have also archived the hundreds of full CORONAVIRUS REPORTS posted here almost daily on the Benicia Independent since April 2020.

RETURN TO TOP

Why experts are ‘not concerned’ San Francisco Bay Area’s COVID rate is highest in California

Solano is only Bay Area County not among highest rates in the state

SFGATE, By Amy Graff, April 6, 2022
San Francisco has the highest COVID-19 case rate of any other county in California, but experts aren’t concerned as cases and hospitalizations are still extremely low compared to what they were amid the winter surge. In this file photo, people wearing masks walk along at path in front of the “Painted Ladies,” a row of historical Victorian homes, and the San Francisco skyline at Alamo Square Park during the coronavirus pandemic in San Francisco. | Jeff Chiu/Associated Press

San Francisco County has the highest COVID-19 case rate of any other county in California with a seven-day average of 13 cases per 100,000 residents, state data showed on Tuesday. By comparison, Los Angeles is reporting 5 cases per 100,000 residents. And San Francisco isn’t the only Bay Area spot sitting at the top of the list. All counties in the region except Solano have among the highest rates in the state.

But multiple experts say this news isn’t alarming, and does not warrant any policy changes. Despite the region’s ranking, cases are extremely low compared to what they were amid the winter surge when the city’s seven-day average soared above 250 cases per 100,000 at the peak.

“No I’m not concerned,” said Dr. George Rutherford, director of UCSF’s Prevention and Public Health Group. “I don’t think it’s any reason to go back to putting the brakes on and our masks back on. We have lots of hospital capacity.”

“I am not too concerned as our hospitals remain eerily quiet — only 2 patients with COVID hospitalized today at the main UCSF Health hospital on Parnassus, compared to close to a 100 in this hospital on January 25,” UCSF infectious diseases expert Dr. Peter Chin-Hong wrote in an email.

“I don’t anticipate any lockdowns, and I am not even sure any restrictions will be re-implemented as long as our hospitals remain protected.” Chin-Hong continued. “There may be disruptions in the community in the workplace and schools as people need to be taken out to isolate for at least 5 days if infected. Is it interesting that countries like the UK, Denmark and South Africa have removed the mandate for a compulsory isolation when infected and this softens the potential disruptions to life in this way.”

While San Francisco’s case rate may not be concerning, you may still be wondering why it’s higher than other places. UCSF’s Dr. Monica Gandhi believes a primary reason is the city’s robust testing apparatus.

“We do a lot of testing in San Francisco with mass community testing sites established via a collaboration between UCSF and the San Francisco Department of Public Health,” Gandhi said. “This allows us to detect slight increases in cases better than other counties in the setting of BA.2 (now 72% of strains in the U.S.) and with increased movement of the population.”

Rutherford agreed that testing is playing into the city’s higher rate and added that the city is a medical hub and people are coming to the city for care that requires testing. “Theoretically, positive tests should be reported back to the county of residence, but that might not always be happening,” he said.

The highly transmissible BA.2 variant — that’s spreading at a time when more people are traveling and society is reopening — is another likely factor, said Chin-Hong.

“A combination of spring break travel, visitors from lots of other parts of the country and world (Asia, Europe), reopening and the resumption of large indoor events like sports and concerts,” Chin-Hong wrote in an email. “This is all fueled by BA.2, which is more transmissible in a city that is compact. There may be more susceptible people to infection in San Francisco and the Bay Area (compared to other parts of the state) who haven’t gotten breakthrough infection with BA.1 and whose immunity to infection has waned. Strategies that have been used in the past to avoid infection may not work quite as well with COVID.”

Could the Bay Area be at the start of a BA.2-driven surge?

The experts that SFGATE talked to all said they don’t expect cases to skyrocket.

“There’s going to be some sort of a sawtooth pattern and it’s not surprising that things are going to be up and down,” said Rutherford. “We’ll see some clusters and bumps from BA2, but I think the overall pattern is it’s going to broaden the base of that curve as it comes down.”

Chin-Hong emphasized that the region has high vaccination rates and this combined with immunity people infected with COVID gained during the original omicron surge “will provide enough immunity ammunition to protect people from getting seriously ill and so protect our hospital resources so we can continue to take care of the spectrum of non-COVID illnesses without interruption.”

Solano County reports 68 new COVID infections and a significant drop in ICU bed availability

NOTE: The information below is not the latest.  TAP HERE for today’s latest information.

By Roger Straw, Monday, April 4, 2022

Solano County’s Monday report: 68 new COVID infections, ICU beds drop to only 28% available.

Solano Public Health COVID dashboard, Monday, April 4, 2022:

DEATHS:  Solano reported no new COVID-related deaths in today’s report.  No deaths reported so far in April.  COMPARE: 17 COVID deaths were reported in March, 15 in February.  A total of 413 Solano residents have now died of COVID or COVID-related causes over the course of the pandemic.

TRANSMISSION RATE: With today’s report, Solano remained in the desired MODERATE transmission rate. with 175 new cases in the last 7 days.  CDC FORMULA: Based on Solano County’s population, 450 or more cases in 7 days places Solano in the CDC’s population-based definition of a HIGH transmission rate.  Below 225 cases in 7 days shows MODERATE community transmission.  Numbers between 225 and 450 are considered SUBSTANTIAL transmission.

ACTIVE CASES: Solano reported 177 ACTIVE cases today, down from 229 at last report.

CASES BY CITY – Monday, April 4, 2022:

  • BENICIA added 3 new cases today, total of 3,138 cases since the outbreak began.  TRANSMISSION RATE: Benicia’s 7-day case count is 11 as of today’s report, back down into the CDC’s MODERATE range.  Benicia has bounced between MODERATE and SUBSTANTIAL range from mid-March until today’s report.  For a city with Benicia’s population, anything over 27 cases in 7 days is considered HIGH TRANSMISSION.  14 to 27 cases is considered SUBSTANTIAL.  Below 14 is rated MODERATE.
  • Dixon added 2 more cases today, total of 4,346 cases.
  • Fairfield added 15 new cases today, total of 22,667 cases.
  • Rio Vista added 0 new case today, total of 1,191 cases.
  • Suisun City added 3 new cases today, total of 5,951 cases.
  • Vacaville added 22 new cases today, a total of 21,650 cases.
  • Vallejo added 21 new cases today, a total of 25,520 cases.
  • Unincorporated added 0 new cases today, a total of 199 cases.

TEST RATE:  Solano County’s 7-Day Percent Positive TEST RATE fell dramatically in March, and reached a new low today, at only 3%. Even at good low rate, Solano does not compare favorably: The CALIFORNIA 7-day % positive rate rose a bit to 1.2% today,  [Source: Johns Hopkins Coronavirus Tracking Center] and the U.S. 7-day % positive rate was also up a bit today from 2.3% to 2.8%. [Source: CDC COVID Data Tracker.] 

HOSPITALIZATIONS:

CURRENT: The number of those currently hospitalized with COVID in Solano County fell today from 7 persons to only 5Current hospitalizations don’t tell the whole story, though, as this number reflects both admissions and discharges.  Only from the increase in total hospitalizations (below) can we know how many new admissions have come into our hospitals as of this date.

TOTAL hospitalizations: Solano Public Health did not update its Age Group and Race/Ethnicity charts today.  TREND: Solano reported 284 hospitalizations in January, 184 in February, and (without explanation) 644 in March.   Solano’s pandemic total of hospitalizations is now 4,337.

ICU Bed Availability Solano County reported its third consecutive substantial drop in available hospital beds today, falling from 46% a week ago to 33% last Thursday, to only 28%, today, landing in the County’s YELLOW danger zone for the first time since March 2.

Ventilator Availability in Solano County remained steady today at 73% available, in the County’s GREEN safe zone. 


HOW DOES TODAY’S REPORT COMPARE?  See recent reports and others going back to April 20, 2020 in my ARCHIVE of daily Solano COVID updates (an excel spreadsheet).

Click green text above or on the image.

>The data on this page is from the Solano County COVID-19 Dashboard.  The Dashboard is full of much more information and (as of 3/14/2022) is updated Monday and Thursday between 4 and 6pm.  On the County’s dashboard, you can hover a mouse or click on an item for more information.  Note the tabs at top for “Summary, Demographics” and “Vaccines.”  Click here to go to today’s Solano County Dashboard.

See also my BENINDY ARCHIVE of daily Solano COVID updates (an excel spreadsheet).  I have also archived the hundreds of full CORONAVIRUS REPORTS posted here almost daily on the Benicia Independent since April 2020.

RETURN TO TOP