
Wednesday, August 18: Summer surge in Solano, report of 380 new infections today, nearly 1,000 ACTIVE cases.
Solano County COVID dashboard SUMMARY:
[Sources: see below. See also my ARCHIVE spreadsheet of daily Solano COVID updates.]
CASES: The County reported 380 new COVID cases over the last two days, 190 per day! We haven’t seen these kind of numbers since the winter surge in January. CASES-PER DAY TREND: We are experiencing a dramatic “summer surge” now. Cases-per-day were trending downward in the Spring, but rose rapidly in July and are skyrocketing here in August: ACTIVE CASES: Solano’s 946 ACTIVE cases rose again from Monday’s 838, up alarmingly from 212 on July 2, and higher than anything since the winter surge.
Hospitalizations up again today
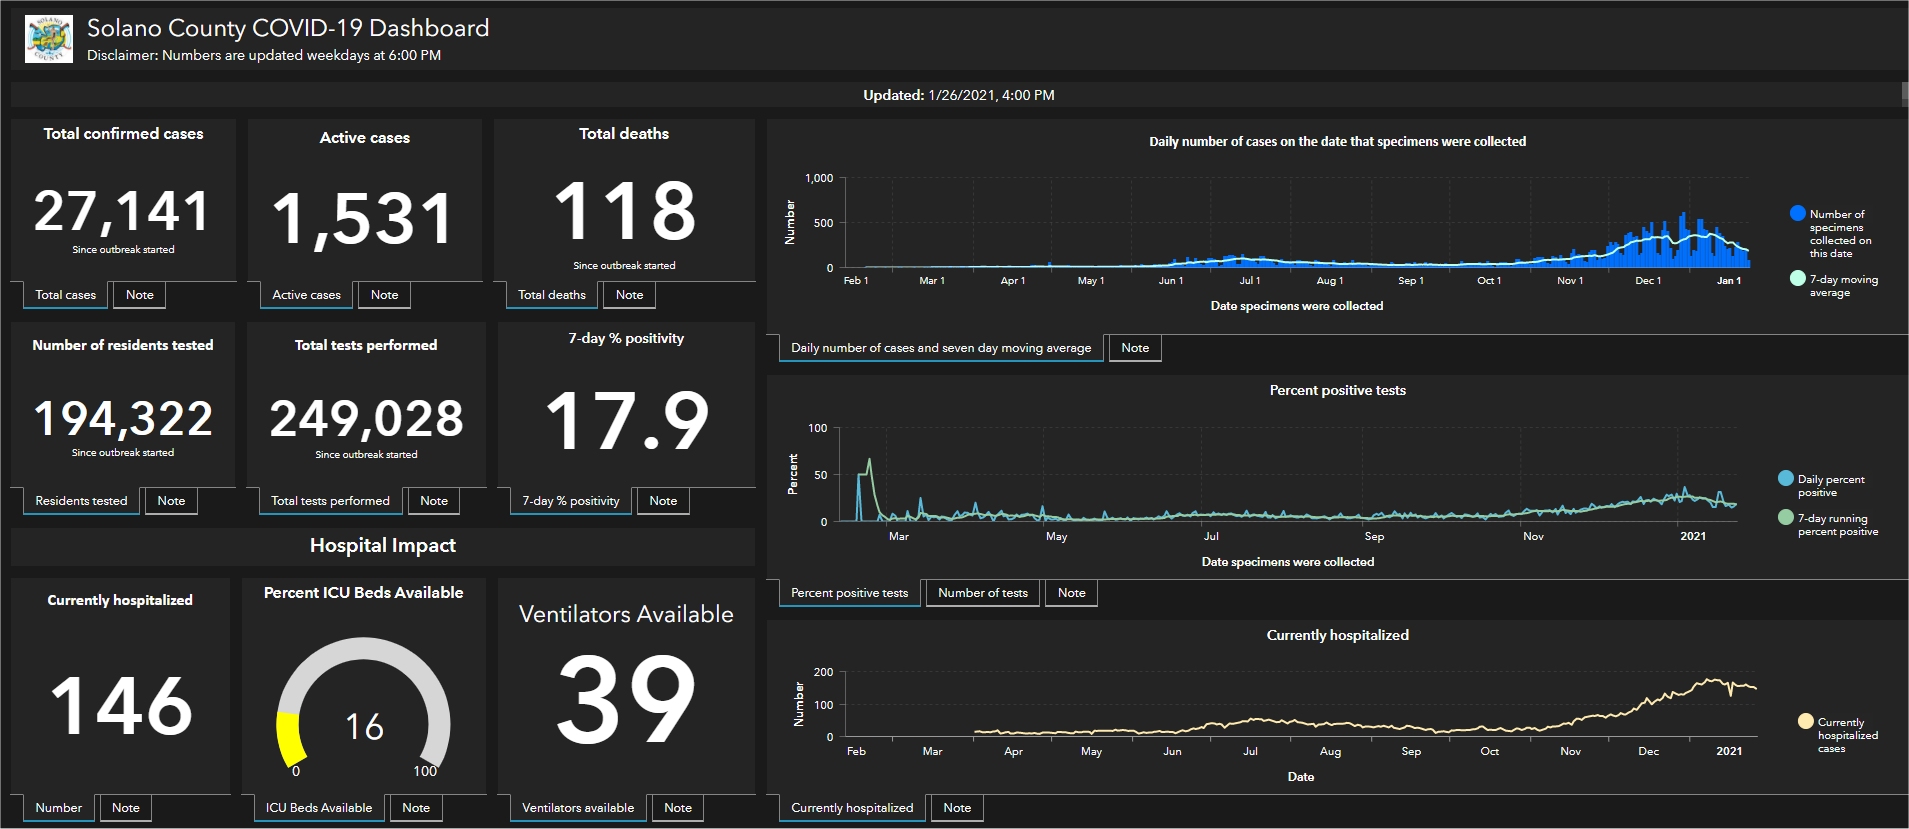
CURRENT hospitalizations rose today from 129 to 143 persons, higher than any time since January 26, 2021.
 ICU Beds Available were up today from 21% to 28%, but still in the yellow danger zone.
Ventilators Available were up today from 56% to 63%.
TOTAL Hospitalized – The County’s Monday-Friday dashboard shows an intake/discharge total of CURRENTLY hospitalized cases (above), but never reports on the TOTAL hospitalized over the course of the pandemic. That total must be independently discovered in the County’s occasional update of the Hospitalizations by Age Group chart. The County updated its Hospitalizations by Age Group chart today, reporting 1 new hospitalization, someone age 18-49. Percentages remain the same. The Age Group chart shows a total of 2,047 persons hospitalized since the beginning of the outbreak, in the following age groups:
| Age Group | Hospitalizations | % of Total |
| 0-17 | 36 | 2% |
| 18-49 | 583 | 28% |
| 50-64 | 547 | 27% |
| 65+ | 881 | 43% |
| TOTAL | 2,047 | 100% |
Hospitalizations are also recorded on the County’s demographic chart labeled “Hospitalizations by Race / Ethnicity.” The chart was updated today, adding 1 person, Hispanic/Latinx. Here are the current numbers, percentages remaining unchanged. Interestingly, the total doesn’t square with the total by age groups.
| Race / Ethnicity | Hospitalizations | % of Total |
| Asians | 323 | 17% |
| Black / African American | 332 | 17% |
| Hispanic / Latinx | 553 | 29% |
| White | 628 | 33% |
| Multirace / Others | 84 | 4% |
| TOTAL | 1,919 | 100% |
Face Coverings…
Good news! Benicia City Council voted yesterday to move forward next week in consideration of a Citywide indoors mask mandate for all public places. This was the first of a two-step process that will return to Council for the second step on next Tuesday, August 24. See also California’s recent Guidance for the Use of Face Coverings. The guidelines include a recommendation for universal masking indoors statewide, adding of Adult and Senior Care Facilities to settings where all individuals must wear masks indoors, and a reference to new requirements for unvaccinated workers. Some California cities and counties are returning to mandatory masks for all in crowded places. In the Bay Area, Solano County REMAINS the only holdout against even RECOMMENDING masks in public indoors spaces. It looks like Dr. Matyas will refuse to make the difficult decisions. Sad – and dangerous!
STUDY SHOWS HIGHER RATE OF “BREAKTHROUGH” CASES AMONG THE VACCINATED
See latest info here: Post-Vaccine COVID-19 Cases by the California Department of Public Health, August 11, 2021. From the report: “For the week of August 7, the average daily COVID-19 case rate among unvaccinated Californians is 51 per 100,000 and the average daily COVID-19 case rate among fully vaccinated Californians is much lower at 8.2 per 100,000.” [I’m no mathematician – could it be that this 51 to 8.2 ratio suggests that one in every seven California cases is a vaccinated person? Someone please confirm or correct me! rogrmail at gmail dot com]
Wearing masks again, social distancing & vaccination…
The “breakthrough” numbers are small in comparison to the huge surge in cases and hospitalizations among the unvaccinated, but it’s still a significant new factor. We were just beginning to associate more freely with fully vaccinated friends and family, and now we understand that a small percentage of the vaccinated among us may be asymptomatic and unknowingly transmitting the virus, and inevitably helping spread the disease to someone who knows someone, who knows someone else, who knows yet another someone who is not vaccinated, or who is too young or too health-compromised to be vaccinated – and who may end up seriously ill or even dead! Please mask indoors in public now, and maybe even indoors with vaccinated family and friends! And PLEASE talk to anyone you know who isn’t vaccinated. This thing ain’t over yet!
Cases by City on Wednesday, August 18:

- Benicia added 10 new cases today, a total of 1,187 cases since the outbreak began, 4.3% of its population of 27,570.
- Dixon added 20 new cases today, total of 2,134 cases, 10.8% of its population of 19,794.
- Fairfield added 103(!) new cases today, total of 10,394 cases, 8.9% of its population of 117,149.
- Rio Vista added 4 new cases today, total of 468 cases, 5.0% of its population of 9,416.
- Suisun City added 21 new cases today, total of 2,694 cases, 9.1% of its population of 29,447.
- Vacaville added 102(!) new cases today, a total of 10,002 cases, 10.1% its of population of 98,807.
- Vallejo added 119(!) new cases today, a total of 11,296 cases, 9.4% of its population of 119,544.
- Unincorporated added 1 new case today, a total of 119 cases (population figures not available).
COMPARE: From the most recent report on Solano County’s COVID Dashboard, Monday, August 16: 


The data on this page is from today’s and the previous Solano County COVID-19 Dashboard. The Dashboard is full of much more information and updated weekdays around 4 or 5pm. On the County’s dashboard, you can hover a mouse or click on an item for more information. Note the tabs at top for “Summary, Demographics” and “Vaccines.” Click here to go to today’s Solano County Dashboard.
Sources
- Solano County Coronavirus Dashboard (posted on the County website today).
- See also my ARCHIVE of daily Solano COVID updates (an excel spreadsheet).
You must be logged in to post a comment.