
25 new cases in our County today. Uptick in percent positive rate. See also: People with mild COVID can have long-term health problems
Solano County COVID report on Tuesday, May 4.
[Source: see far below. See also my ARCHIVE spreadsheet of daily Solano COVID updates.]Solano County COVID-19 Dashboard – SUMMARY:

On May 4, Solano County reported 25 new COVID cases. We saw 1,288 new cases in April, an average of 43 per day. Reports are that Solano will not be joining all other Bay Area counties in the State’s orange tier anytime soon. Solano’s Active cases went down today, falling from 321 to 310. Our percent positivity rate rose again today to 8.4%, after rising dramatically yesterday to 8.2%. We have not seen rates this high since Feb. 22.
Cases among children and youth have increased alarmingly
| Percent of TODAY’S new cases, by age groups, May 4, 2021 | ||||
| New Cases 0-17 years |
New Cases 18-49 years |
New Cases 50-64 years |
New Cases 65+ years |
TOTAL New Cases Today |
| 6 | 14 | 4 | 1 | 25 |
| 24% | 56% | 16% | 4% | 100% |
COMPARE TODAY (above) WITH PERCENTAGES SINCE LAST SUMMER (below). Since last June, cases among children and youths 0-17 years of age have increased dramatically as a percentage of total cases. This chart shows the changes among age groups over the past 11 months.
| Solano County COVID-19 – CASES SINCE JUNE 2020, BY AGE GROUP AS % OF TOTAL | ||||
| Date | Cases % 0-17 |
Cases % 18-49 |
Cases % 50-64 |
Cases % 65+ |
| 6/5/20 | 5.8% | 45.2% | 25.6% | 23.3% |
| 7/1/20 | 9.0% | 57.5% | 20.1% | 13.4% |
| 8/31/20 | 11.0% | 60.6% | 19.2% | 9.2% |
| 5/4/21 | 12.2% | 55.4% | 20.5% | 11.9% |
Hospitalizations – very little information…
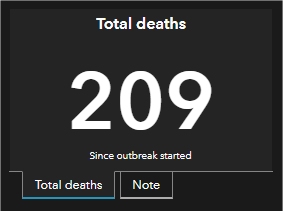
The Solano County COVID dashboard Summary tab only shows active hospitalizations for the current day (23 today, see image at top of page). This number represents the total currently hospitalized after yesterday’s admissions and discharges. Little can be learned from this about the accumulated total of hospitalizations since the outbreak began.

But on the Demographics tab of the County dashboard, the County “occasionally” updates the accumulated total of hospitalizations by age group. These numbers have not been updated since early April, so it isn’t possible to determine whether there has been an increasing number of hospitalizations among our children and young adults. I have asked Public Health Officer Dr. Bela Matyas for an update on these numbers, and he replied by email on 4/29 that he “believes” his staff will update these numbers soon, and “will double check.” But no update as yet. So age group hospitalization totals on the dashboard remain old and unchanged:
| Solano County Total COVID Hospitalizations by AGE GROUPS as of Early April | |||
| Hospitalizations Age 0-17 |
Hospitalizations Age 18-49 |
Hospitalizations Age 50-64 |
Hospitalizations Age 65+ |
| 26 | 323 | 330 | 591 |
>> The virus is still on the move here. Stay safe, get vaccinated, wear a mask and social distance! We will get through this together.
Cases by City on Monday, May 4:

- Benicia remained steady today, total of 972 cases since the outbreak began. Benicia averaged 2 cases per day in April.
- Dixon added 1 new case today, total of 1,871 cases.
- Fairfield added 8 new cases today, total of 8,841 cases.
- Rio Vista remained steady today, total of 369 cases.
- Suisun City added 2 new cases today, total of 2,232 cases.
- Vacaville added 6 new cases today, total of 8,528 cases.
- Vallejo added 8 new cases today, total of 9,698 cases.
- Unincorporated areas remained steady today, total of 102 cases.
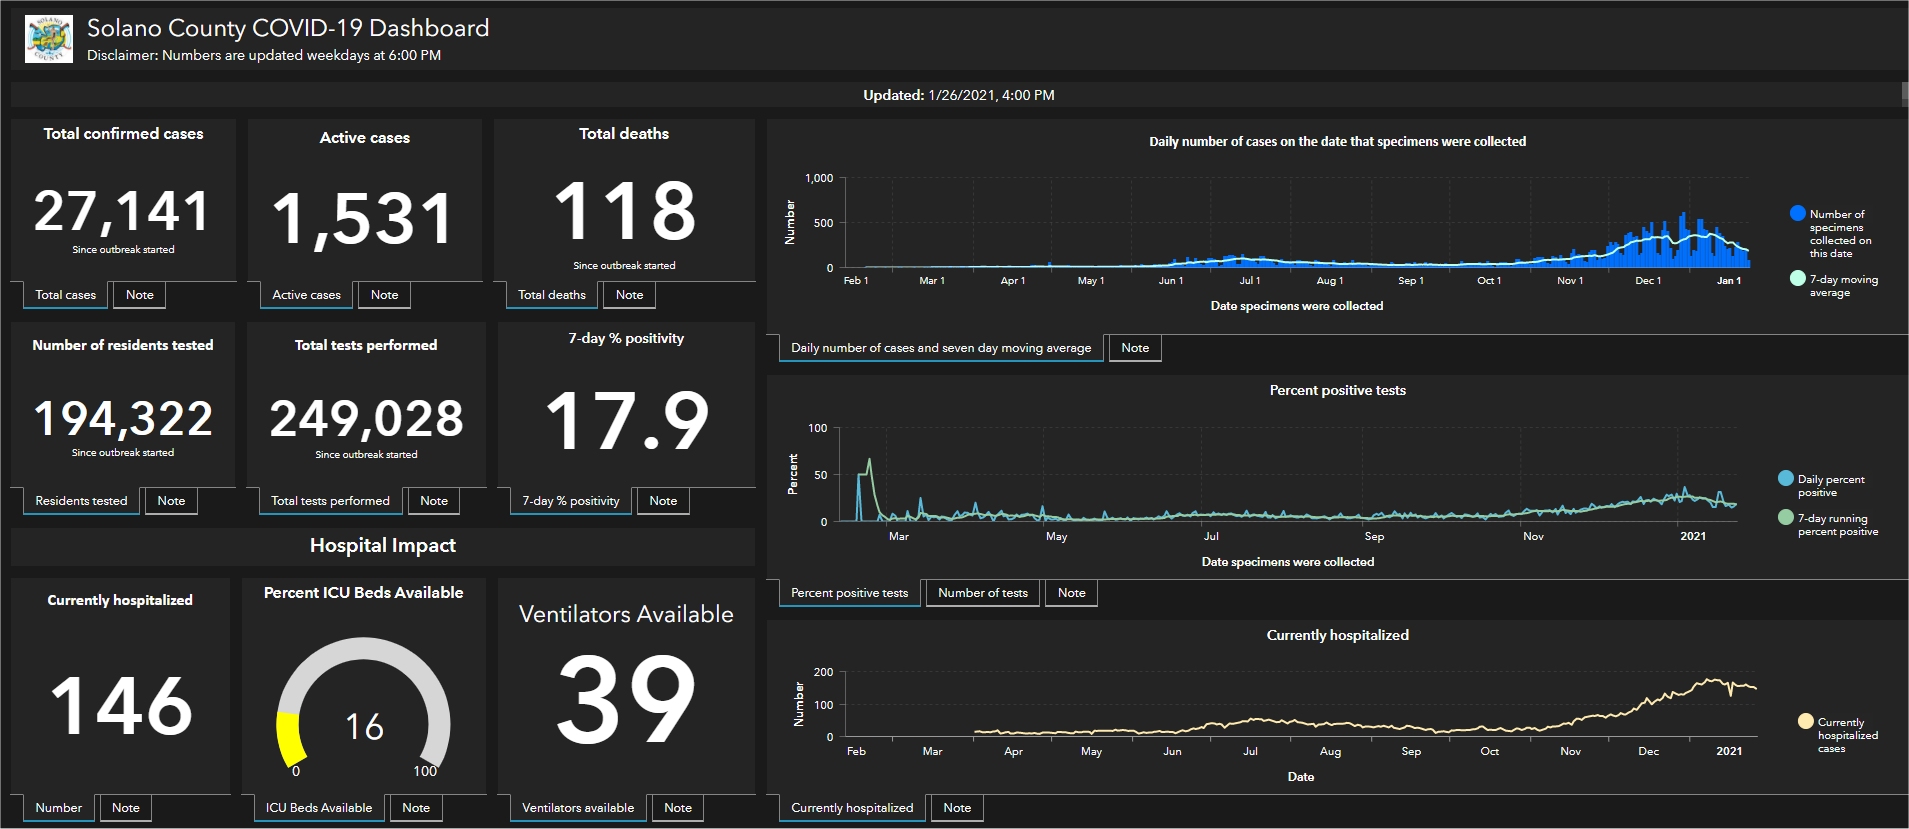
COMPARE: Screenshots from Solano County COVID Dashboard on Monday, May 3:


The data on this page is from today’s and the previous Solano County COVID-19 Dashboard. The Dashboard is full of much more information and updated weekdays around 4pm. On the County’s dashboard, you can hover a mouse or click on an item for more information. Note the tabs at top for Summary, Demographics and Vaccines. Click here to go to today’s Solano County Dashboard.
Sources
- Solano County Coronavirus Dashboard (posted on the County website today).
- The State of California’s Open Data Profile at COVID19.CA.GOV
- See also on the BenIndy: Hospitalizations AND ICU Beds by REGION.
- See also my ARCHIVE of daily Solano COVID updates (an excel spreadsheet).


You must be logged in to post a comment.