By Roger Straw, February 3, 2021 NOTE:The Benicia Happenings Facebook information about a mass vaccination event on Feb. 5-6 the Fairgrounds in Vallejo is verified here: solanocounty.com/depts/ph/coronavirus_links/covid_19_vaccines.aspBUT… You will not find details about the location or timing on there on the County’s vaccination page. The ONLY WAY TO GET VACCINATED AT THE COUNTY’S VACCINATION EVENT IS TO REGISTER. CLICK ON “COVID-19 VACCINATION FORM” NEAR THE TOP OF THE PAGE. The County will contact you when you are eligible for a vaccination appointment.
Solano County plans to open a mass vaccination clinic at the fairgrounds in Vallejo this Friday and Saturday. County residents 75 and older and those in Tier One are eligible. Please get yourself registered as soon as possible, and encourage others. Those eligible will be notified tomorrow.
Solano Public Health >>To receive notification about the availability of the COVID-19 vaccine when it is made available to certain phases and tiers, please fill out the vaccine interest form here: http://bit.ly/SolanoVaccineInterestForm
Special today: January case numbers and daily averages BY CITY (below). Stay home whenever possible – this is not over!
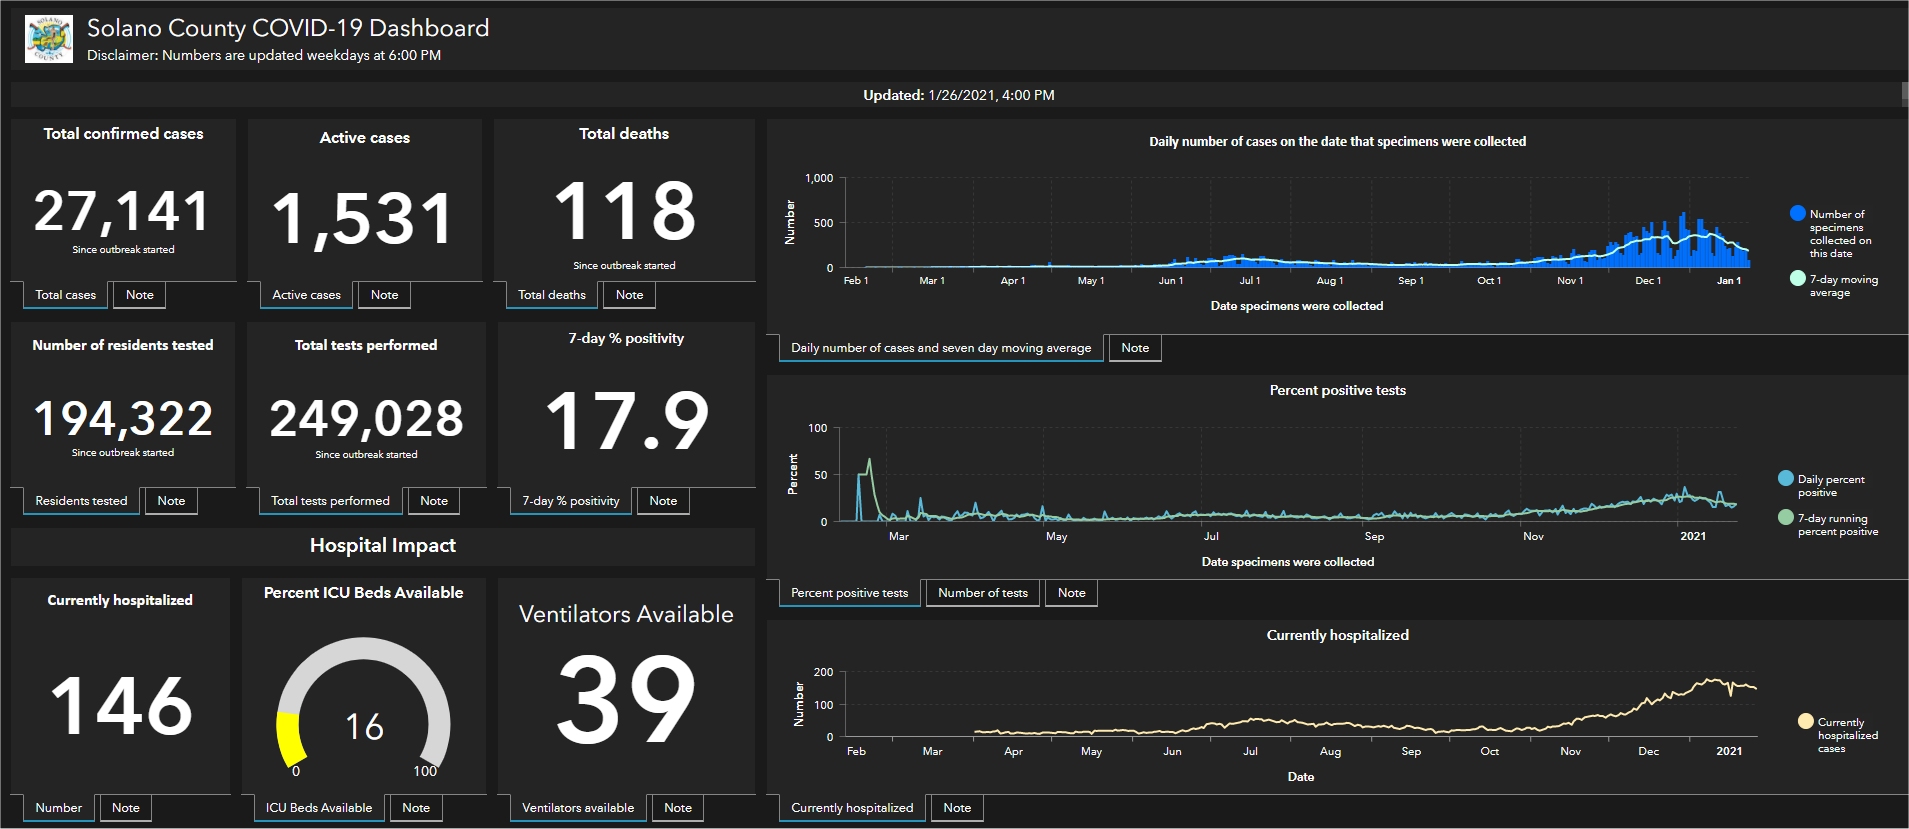
Thursday, January 28: 169 new Solano cases overnight, and again, 1 new death. Since Feb: 27,486 cases, over 820 hospitalized, 122 deaths.Compare previous report, Wednesday, Jan. 27:Summary
Solano County reported 169 new cases overnight, total of 27,486 cases since the outbreak started. In the first 28 days of January, Solano has added 8,275 new cases, for an AVERAGE of 296 new cases per day.
[sta_anchor id=”deaths” /]Deaths – 1 new death reported today, someone over 65 years of age, a total of 122 Solano deaths since the pandemic began. There have been 17 COVID-related deaths in Solano County over the last 9 days, 2 aged 18-49 years, 15 others over 65 years of age. While many other COVID stats are improving, these deaths are the final sad result of our holiday surge.
Active cases – Solano reported 33 more active cases today, a total of 1,505 active cases. Compare: Solano’s average number of Active Cases during October was 284, average in November was 650, in December 1,658 – and TODAY we are at 1,505. Better, but still a LOT! Is the County equipped to contact trace so many infected persons? Or do we just sit back and wait for a voluntary 10 day quarantine to expire. Who knows? To my knowledge, Solano has offered no reports on contact tracing.
Hospitalizations –(See expanding ICU capacity and ventilator availablity below.) Today, Solano reported 1 fewer currently hospitalized cases, total of 137. No change today in the number of hospitalizations among age groups. (The County posted its “occasional” large group of updated numbers on hospitalizations among the age groups yesterday, adding 5 in the 50-64 year age group and 12 more in the 65+ age group, for a total of 820 hospitalized in all age groups since the pandemic began.) Even then, accuracy cannot be certain – note… >>In a December 31 Fairfield Daily Republic article, reporter Todd Hanson wrote, “Since the start of the pandemic, and as of Wednesday, 9,486 residents have been hospitalized.” This startling number isfar and away above the number of residents hospitalized as indicated in the count of age group hospitalizations, and not available anywhere on the County’s COVID-19 dashboard.Asked about his source, Hanson replied that Solano Public Health “had to do a little research on my behalf.” It would be good if the County could add Total Hospitalized to its daily Dashboard update. [For the numbers used in my manual calculation of total hospitalizations, see age group stats below. For COVID19-CA.GOV numbers, see BenIndy page, COVID-19 Hospitalizations Daily Update for Solano County.][sta_anchor id=”icu” unsan=”ICU” /]
Ventilators available – This week, for the first time since July 24 of last year, Solano County is reporting the percentage of ventilators available. Today Solano hospitals have 41% of ventilators available, up from 26% yesterday but down substantially from last summer’s reports of 82-94% available.
Positive Test Rate – SOLANO TEST RATE REMAINS ALARMINGLY HIGH, 16.9% – VIRUS STILL SPREADING, STAY HOME!
Solano County reported our 7-day average positive test at an alarming rate of 16.9%, down a bit from yesterday’s 17.3%, but still more than 2 times the State’s purple tier threshold of 8%. Average percent positive test rates are among the best metrics for measuring community spread of the virus. COMPARE: The much lower and more stable California 7-day average test rate was down slightly from yesterday’s 7.7% to 7.5% today. (Note that Solano County displays past weeks and months in a 7-day test positivity line graph which also shows daily results. However, the chart does not display an accurate number of cases for the most recent days, as there is a lag time in receiving test results. The 7-day curve therefore also lags behind due to unknown recent test results.)
By Age Group
Youth 17 and under – 18 new cases overnight, total of 3,192 cases, representing 11.6% of the 27,486 total cases. No new hospitalizations reported today among this age group, total of 17 since the outbreak began. Thankfully, no deaths have ever been reported in Solano County in this age group. But cases among Solano youth rose steadily over the summer, from 5.6% of total cases on June 8 to 11% on August 31 and has plateaued at over 11% since September 30. Youth are 22% of Solano’s general population, so this 11% may seem low. The significance is this: youth are SERIOUSLY NOT IMMUNE (!) – in fact at least 17 of our youth have been hospitalized since the outbreak began.
Persons 18-49 years of age – 97 new cases overnight, total of 15,183 cases. This age group is 41% of the population in Solano, but represents 55.3% of the total cases, by far the highest percentage of all age groups. The County reported no new hospitalizations among persons in this age group today. A total of 241 are reported to have been hospitalized since the outbreak began. Solano recorded no new deaths in this young group today, total of 9 deaths. Some in this group are surely at high risk, as many are providing essential services among us, and some may be ignoring public health orders. I expect this group is a major factor in the spread of the virus.
Persons 50-64 years of age – 38 new cases overnight, total of 5,732 cases. This age group represents 20.9% of the 27,486 total cases. The County reported no new hospitalizations among persons in this age group today. A total of 222 are reported to have been hospitalized since the outbreak began. No new deaths were reported in this age group today, a total of 18 deaths.
Persons 65 years or older – 16 new cases overnight, total of 3,368, representing a high of 12.3% of Solano’s 27,486 total cases. The County reported no new hospitalizations among persons in this age group today, a total of 340 hospitalized since the outbreak began. 1 new death was reported in this age group today. A total of 95 of our elders have died of COVID, accounting for 78%of Solano’s 122 total deaths.[sta_anchor id=”citydata” /]
City Data
Benicia added 5 new cases overnight, total of 774 cases since the outbreak began. 266 new cases in January, avg. of 9.5 per day.
Dixon added 5 new cases overnight, total of 1,638 cases. 417 new cases in January, avg. of 15 per day.
Fairfield added 38 new cases overnight, total of 7,590 cases. 2,147 new cases in January, avg. of 77 per day.
Rio Vista added 1 new cases today, total of 262 cases. 97 new cases in January, avg. of 3 per day.
Suisun City added 14 new cases overnight, total of 1,879 cases. 533 new cases in January, avg. of 19 per day.
Vacaville added 33 new cases overnight, total of 7,223 cases. 2,369 new cases in January, avg. of 85 per day.
Vallejoadded 73 new cases overnight, total of 8034 cases. 2,421 new cases in January, avg. of 86 per day.
Unincorporated areas remained steady today, total of 86 cases. 25 new cases in January, avg. of nearly 1 per day.
Race / Ethnicity
The County report on race / ethnicity includes case numbers, hospitalizations, deaths and Solano population statistics. This information is discouragingly similar to national reports that indicate significantly worse outcomes among black and brown Americans. Note that all of this data surely undercounts Latinx Americans, as there is a large group of “Multirace / Others” which likely is composed mostly of Latinx members of our communities.
Asian Americans are 14% of Solano’s population, and account for 12% of cases, 12% of hospitalizations, and 17% of deaths.
Black Americans are 14% of Solano’s population, and account for 11% of cases, but 17% of hospitalizations, and 22% of deaths.
Latinx Americans are 26% of Solano’s population, but account for 13% of cases, 22% of hospitalizations, and 15% of deaths.
Multi-race / Others are 7% of Solano’s population, but account for 35% of cases, 18% of hospitalizations, and 12% of deaths.
White Americans are 39% of the population in Solano County, but only account for 29% of cases, 30% of hospitalizations and 34% of deaths.
By Roger Straw, December 24, 2020 [Sources: see below.]
Thursday, December 24: 486 new cases overnight, no new deaths. Since Feb: 17,330 cases, more than 725 hospitalized, 95 deaths.Compare previous report, Wednesday, Dec. 23:Summary
Solano County reported 486 (!!) new cases overnight, A NEW SINGLE-DAY RECORD INCREASE IN POSITIVE CASES. In just the last 14 days, Solano has seen an increase of 4,764 new cases. We’re averaging 340 (!!) new cases every day! (source: covid19.ca.gov) Total of 17,330 cases since the outbreak started.
Deaths – No new deaths reported today, a total of 95 Solano deaths since the pandemic began.
Active cases – Solano reported135 more active cases today for a total of 1,555 active cases. Solano’s average number of Active Cases during October was 284, average in November was 650 – and TODAY we are at 1,555! Is the County equipped to contact trace so many infected persons? Who knows? To my knowledge, Solano has offered no reports on contact tracing.
Hospitalizations –CAUTION ON SOLANO HEALTH DEPARTMENT REPORTING: According to Solano Health Officer Dr. Bela Matyas, the County “occasionally” updates Age Group hospitalizations retroactively, adding substantial numbers. Thus, many hospitalizations are never reported as CURRENTLY hospitalized. Today, Solano reported 4 fewer CURRENTLY hospitalized persons, total of 118. And among the age groups, the County reported no change in hospitalization numbers, for a continuing total of 728 persons hospitalized since the outbreak began. [For the numbers used in my manual calculation of total hospitalizations, see age group stats below. For COVID19-CA.GOV numbers, see BenIndy page, COVID-19 Hospitalizations Daily Update for Solano County.]
Testing – The County report on COVID-19 testing today showed “UNAVAILABLE.” As of yesterday, Solano had tested a total of 159,358 unduplicated residents since the outbreak began. 35.6% of Solano County’s 447,643 residents (2019) have been tested.
Positive Test Rate – 1 IN EVERY 5 TESTED IS POSITIVE – VIRUS SPREADING LIKE WILDFIRE
Solano County reported our 7-day average positive test rate today at 20.9%, up from yesterday’s 18.6%, far and away over the State’s purple tier threshold of 8%. Average percent positive test rates are among the best metrics for measuring community spread of the virus. The much lower and more stableCalifornia 7-day average test rate has also been on an alarming rise lately, down from yesterday’s 12.6% to 12.1% today. (Note that Solano County displays past weeks and months in a 7-day test positivity line graph which also shows daily results. However, the chart does not display an accurate number of cases for the most recent days, as there is a lag time in receiving test results. The 7-day curve therefore also lags behind due to unknown recent test results.)
By Age Group – Continuing the post-Thanksgiving surge, especially in age groups 18-49 and 50-64 years
Youth 17 and under – 42 new cases today, total of 1,931 cases, representing 11.2% of the 17,330 total cases. No new hospitalizations reported today among this age group, total of 17 since the outbreak began. Thankfully, no deaths have ever been reported in Solano County in this age group. But cases among Solano youth rose steadily over the summer, from 5.6% of total cases on June 8 to 11% on August 31 and has plateaued at over 11% since September 30. Youth are 22% of Solano’s general population, so this 11.x% may seem low. The significance is this: youth are SERIOUSLY NOT IMMUNE (!) – in fact at least 14 of our youth have been hospitalized since the outbreak began.
Persons 18-49 years of age – 237 (!!) new cases today, total of 9,945 cases. This age group is 41% of the population in Solano, but represents nearly 60% of the total cases, by far the highest percentage of all age groups. The County reported no new hospitalizations among persons in this age group today. A total of 233 are reported to have been hospitalized since the outbreak began. Solano recorded no new deaths in this young group today, total of 7 deaths. Some in this group are surely at high risk, as many are providing essential services among us, and some may be ignoring public health orders. I expect this group is a major factor in the spread of the virus.
Persons 50-64 years of age – 142 (!!) new cases today, total of 3,552 cases. This age group represents just over 20% of the 17,330 total cases. The County reported no new hospitalizations among persons in this age group today. A total of 196 are reported to have been hospitalized since the outbreak began. No new deaths in this age group today, a total of 16 deaths.
Persons 65 years or older – 65 (!) new cases today, total of 1,828, representing 10.9% of Solano’s 17,330 total cases. The County reported no new hospitalizations among persons in this age group today. A total of 282 have been hospitalized since the outbreak began. No new deaths were reported in this age group today. A total of 72 of our elders have died of COVID, accounting for 76%of Solano’s 95 total deaths.[sta_anchor id=”citydata” /]
City Data
Benicia added 9 new cases today, total of 469 cases since the outbreak began.
Dixon added 19 new cases today, total of 1138 cases.
Fairfield added 91 (!) new cases today, total of 4,957 cases.
Rio Vista added 4 new cases today, total of 143 cases.
Suisun City added 27 new cases today, total of 1,207 cases.
Vacaville added 265 (!!!) new cases today, total of 4,185 cases. Something is happening in Vacaville – stay tuned!
Vallejoadded 71 new cases today, total of 5,170 cases.
Unincorporated areas remained steady today, total of 61 cases.
Race / Ethnicity
The County report on race / ethnicity includes case numbers, hospitalizations, deaths and Solano population statistics. This information is discouragingly similar to national reports that indicate significantly worse outcomes among black and brown Americans. Note that all of this data surely undercounts Latinx Americans, as there is a large group of “Multirace / Others” which likely is composed mostly of Latinx members of our communities.
Asian Americans are 14% of Solano’s population, and account for 10% of cases, 12% of hospitalizations, and 18% of deaths.
Black Americans are 14% of Solano’s population, and account for 11% of cases, but 16% of hospitalizations, and 21% of deaths.
Latinx Americans are 26% of Solano’s population, but account for 18% of cases, 25% of hospitalizations, and 17% of deaths.
White Americans are 39% of the population in Solano County, but only account for 28% of cases, 29% of hospitalizations and 32% of deaths.[sta_anchor id=”below” /]
How Bay Area ICU capacity compares to the most impacted areas in California, nation
San Francisco Chronicle, by Kellie Hwang, Dec. 11, 2020
Nurse Waymond Jones (left) Respiratory Therapist Laura Sandoval (center) and nurse Larry Ngiraswei (right) prepare to prone a COVID-19 patient in the ICU at Regional Medical Center of San Jose, an acute-care hospital, on Tuesday, Dec. 8, 2020 in San Jose, California. Following Thanksgiving there has been an uptick in COVID-19 cases all over California and the Bay Area. Photo: Gabrielle Lurie / The Chronicle
Hospitals in the Bay Area, California and across the nation are running short of intensive care unit beds as the latest coronavirus surge sets new records for cases, hospitalizations and deaths.
On Thursday, California reported a record 2,710 ICU hospitalizations, and four of five state regions, including part of the Bay Area, were under the regional stay-at-home order issued last week by Gov. Gavin Newsom. The order is triggered when available ICU hospital capacity dips below 15%.
The five regions, based on California’s mutual aid system and emergency response networks, are the Bay Area, Southern California, the San Joaquin Valley, Greater Sacramento and Northern California.
The Southern California region, with 7.7% ICU availability as of Thursday, and the San Joaquin Valley, with just 1.9% availability, fell under the stay-at-home order last weekend. Restrictions went into effect overnight Thursday for the Greater Sacramento area, with 13.3% availability.
The Bay Area region was at 17.8% available ICU capacity Thursday, though five of its 11 counties — San Francisco, Alameda, Contra Costa, Santa Clara and Marin — have voluntarily tightened restrictions in line with the state order. Sonoma County announced Thursday it will join them this weekend. Northern California had the highest ICU availability in the state, at 30.3%.
Critical shortages are occurring across the nation. On Monday, the U.S. Department of Health and Human Services began releasing COVID-19 hospital capacity data at the facility level, aggregating daily hospital reports and sharing them on a weekly basis. The New York Times has created an interactive map detailing the ICU capacity throughout the U.S. [BenIndy editor: The NYTimes map shows Fairfield (22 of 30 ICU beds occupied, 75% on Dec. 9) as well as Vallejo (20 of 24, 81%) and Vacaville (10 of 11, 91%). It’s a little hard to navigate the map, but worth it for the numbers. – R.S.]
Here are the ICU occupancy rates for both the most-impacted and the largest high-population locations in the Bay Area, compared with California and the U.S., according to the data released Monday. The figures are based on seven-day average patient count by hospital service area.
Daly City: 100% of ICU beds occupied
Santa Rosa: 95% of ICU beds occupied
Vacaville: 91% of ICU beds occupied
South San Francisco: 90% of ICU beds occupied
San Leandro: 90% of ICU beds occupied
Petaluma: 88% of ICU beds occupied
Martinez: 83% of ICU beds occupied
Fremont: 83% of ICU beds occupied
Vallejo: 81% of ICU beds occupied
Castro Valley: 80% of ICU beds occupied
Sonoma County
In Santa Rosa, the largest city in Sonoma County, ICUs are 95% full. Sonoma County did not initially join the five Bay Area counties in adopting the stay-at-home measure, but officials announced Thursday that the county would adopt it starting Saturday at 12:01 a.m.
“Although Sonoma County has fared better until now than other parts of the state in terms of demand on our hospitals, we have been seeing an alarming increase in cases and hospitalizations in recent days, and this is putting increased strain on our medical resources,” county health officer Dr. Sundari Mase said in a news release. “We feel we have no choice but to join the other Bay Area counties in preemptively adopting the governor’s Stay-Home order.”
Mase noted that hospitalizations in Sonoma are near the county’s highest ever, and that coronavirus case rates are at their highest since the pandemic began. “We also are seeing a wider geographic spread of infection,” Mase said. She tied the increases to the surge in cases across the nation as well as large gatherings in the county, including over Halloween and Thanksgiving.
At a community briefing on Wednesday, the most recent ICU available capacity was reported at 11.6% in Sonoma County. ICU beds occupied in Sonoma are at 57%, Healdsburg is at 20% and Petaluma stands at 88%. The county removed hospital capacity data from its website, and the Press Democrat reported that officials are working with the state to fix discrepancies between the county and state websites.
MOST IMPACTED CALIFORNIA
Daly City: 100% of ICU beds occupied
Huntington Beach (Orange County): 100% of ICU beds occupied
Ventura: 99% of ICU beds occupied
Upland (San Bernardino County): 97% of ICU beds occupied
Chula Vista (San Diego County): 97% of ICU beds occupied
Oxnard (Ventura County): 96% of ICU beds occupied
Victorville (San Bernardino County): 95% of ICU beds occupied
Thousand Oaks (Ventura County): 95% of ICU beds occupied
Santa Rosa: 95% of ICU beds occupied
Fresno: 95% of ICU beds occupied
Lynwood (Los Angeles County): 95% of ICU beds occupied
Northridge (Los Angeles County): 95% of ICU beds occupied
Arcadia (Los Angeles County): 94% of ICU beds occupied
Redlands (San Bernardino County): 94% of ICU beds occupied
Fontana (San Bernardino County): 93% of ICU beds occupied
In Ventura County, the cities of Ventura, Oxnard, Thousand Oaks and Camarillo are all at more than 95% ICU capacity. The county is grouped in the Southern California region, which is under the regional stay-at-home order. County supervisors have unanimously voted to propose a new region that would include Santa Barbara and San Luis Obispo counties, which have much higher available ICU capacity and therefore likely could remove restrictions on businesses sooner.
MOST IMPACTED U.S.
Albuquerque, N.M.: 116% of ICU beds occupied
Baton Rouge, La.: 109% of ICU beds occupied
Ogden, Utah: 107% of ICU beds occupied
Upland, Pa.: 106% of ICU beds occupied
Easton, Pa.: 104% of ICU beds occupied
Abington, Pa.: 102% of ICU beds occupied)
Pompano Beach, Fla.: 100% of ICU beds occupied
Port St. Lucie, Fla.: 100% of ICU beds occupied
Dothan, Ala.: 100% of ICU beds occupied
Douglasville, Ga.: 100% of ICU beds occupied
Wailuku, Hawaii: 100% of ICU beds occupied
Chicago Heights, Ill.: 100% of ICU beds occupied
Leonardtown, Md.: 100% of ICU beds occupied
St. Joseph, Mo.: 100% of ICU beds occupied
St. Cloud, Minn.: 100% of ICU beds occupied
Albuquerque
The hospital service area that includes Albuquerque shows the highest ICU occupancy in the nation at 116%. In mid-November, New Mexico Gov. Michelle Lujan Grisham tightened restrictions statewide in hopes of reducing the virus spread, but that wasn’t enough. On Nov. 20, a backup hospital in Albuquerque was opened to relieve the strain. Now hospitals are reaching surge capacity at nearly 1,000 hospitalizations daily. Officials are preparing to ration care to coronavirus patients, with the only criterion being whether a person is likely to survive.
TOP LARGEST LOCATIONS IN THE BAY AREA GROUP
San Francisco: 72% of ICU beds occupied
Oakland: 62% of ICU beds occupied
Santa Rosa: 95% of ICU beds occupied
San Jose: 68% of ICU beds occupied
Greenbrae: 59% of ICU beds occupied
Napa: 45% of ICU beds occupied
Vallejo: 81% of ICU beds occupied
Daly City: 100% of ICU beds occupied
Concord: 78% of ICU beds occupied
Salinas: 61% of ICU beds occupied
Santa Cruz: 76% of ICU beds occupied
TOP LARGEST CALIFORNIA CITIES
Los Angeles: 80% of ICU beds occupied
San Diego: 65% of ICU beds occupied
San Jose: 68% of ICU beds occupied
San Francisco: 72% of ICU beds occupied
Fresno: 95% of ICU beds occupied
Sacramento: 83% of ICU beds occupied
Long Beach: 51% of ICU beds occupied
Oakland: 62% of ICU beds occupied
Bakersfield: 75% of ICU beds occupied
Anaheim: 87% of ICU beds occupied
Santa Ana: 37% of ICU beds occupied
Riverside: 88% of ICU beds occupied
Stockton: 90% of ICU beds occupied
Irvine: No ICU data reported from local hospitals
Chula Vista: 97% of ICU beds occupied
Chula VIsta
Chula Vista, in San Diego County, has the highest percentage of ICU beds occupied at 97%. San Diego County’s hospitals have seen a crush of coronavirus admissions since late November, and some facilities have reported that they are already utilizing surge beds, concerned about an increase of cases due to the Thanksgiving holiday.
TOP LARGEST U.S. CITIES
New York City: 78% of ICU beds occupied
Los Angeles: 80% of ICU beds occupied
Chicago: 65% of ICU beds occupied
Houston: 91% of ICU beds occupied
Phoenix: 64% of ICU beds occupied
Philadelphia: 84% of ICU beds occupied
San Antonio: 91% of ICU beds occupied
San Diego: 65% of ICU beds occupied
Dallas: 93% of ICU beds occupied
San Jose: 68% of ICU beds occupied
Austin, Texas: 85% of ICU beds occupied
Jacksonville, Fla.: 79% of ICU beds occupied
Fort Worth, Texas: 92% of ICU beds occupied
Columbus, Ohio: 83% of ICU beds occupied
Charlotte, N.C.: 81% of ICU beds occupied
Texas
Dallas has the lowest ICU capacity on this list, with just 7% of ICU beds available. Dallas County recently reported the second-highest daily death toll in the pandemic, and the county had to lower business capacity from 75% to 50% on Dec. 3 after going over the 15% ICU capacity threshold.
Fort Worth, in Texas’ Tarrant County, follows closely behind with 92% of ICU beds occupied. The Tarrant County Medical Examiner’s office is near storage capacity for bodies, so two refrigerated trucks have been brought in and are expected to be used soon.



You must be logged in to post a comment.