Tag Archives: Suisun City CA

Solano County COVID report: 18-49 year-olds catching the virus


By Roger Straw, Friday, April 9, 2021

38 new COVID-19 cases overnight.  Still important to stay safe … see report on 18-49 year-olds below.

Solano County COVID report on Friday, April 9:Solano Cities – Benicia  has lowest RATE of infections, Dixon and Vacaville have highest infection rates.
[Source: see below.  See also my ARCHIVE of daily Solano COVID updates (an excel spreadsheet).]
On April 9, Solano County reported 38 new COVID cases overnight, down from 51 last Thursday and 61 on last Friday.  Solano reported a total of 292 new cases last week, averaging 42 per day, keeping us from joining all other Bay Area counties in the State’s orange tier.
>> The virus is still on the move here.  Stay safe, get vaccinated, wear a mask and social distance!  We will get through this together.

Recently, most new cases are among those of us aged 18-49!

Solano Age Groups – Total cases & new cases reported on April 9
0-17 Total Cases New cases today 18-49 Total Cases New cases today 50-64 Total Cases New cases today 65+ Total Cases New cases today
3,730 2 17,462 27 6,526 8 3,798 1

Ages 0-17 count for 11.8% of all cases
Ages 18-49 count for 55.4% of all cases
Ages 50-64 count for 20.7% of all cases
Ages 65+ count for 12.1% of all cases

On average, those of us age 18-49 are most likely to catch the virus.  The chart below shows the rate of Solano cases by age groups (per 100,000 population, as of today).  Click the image for better detail.

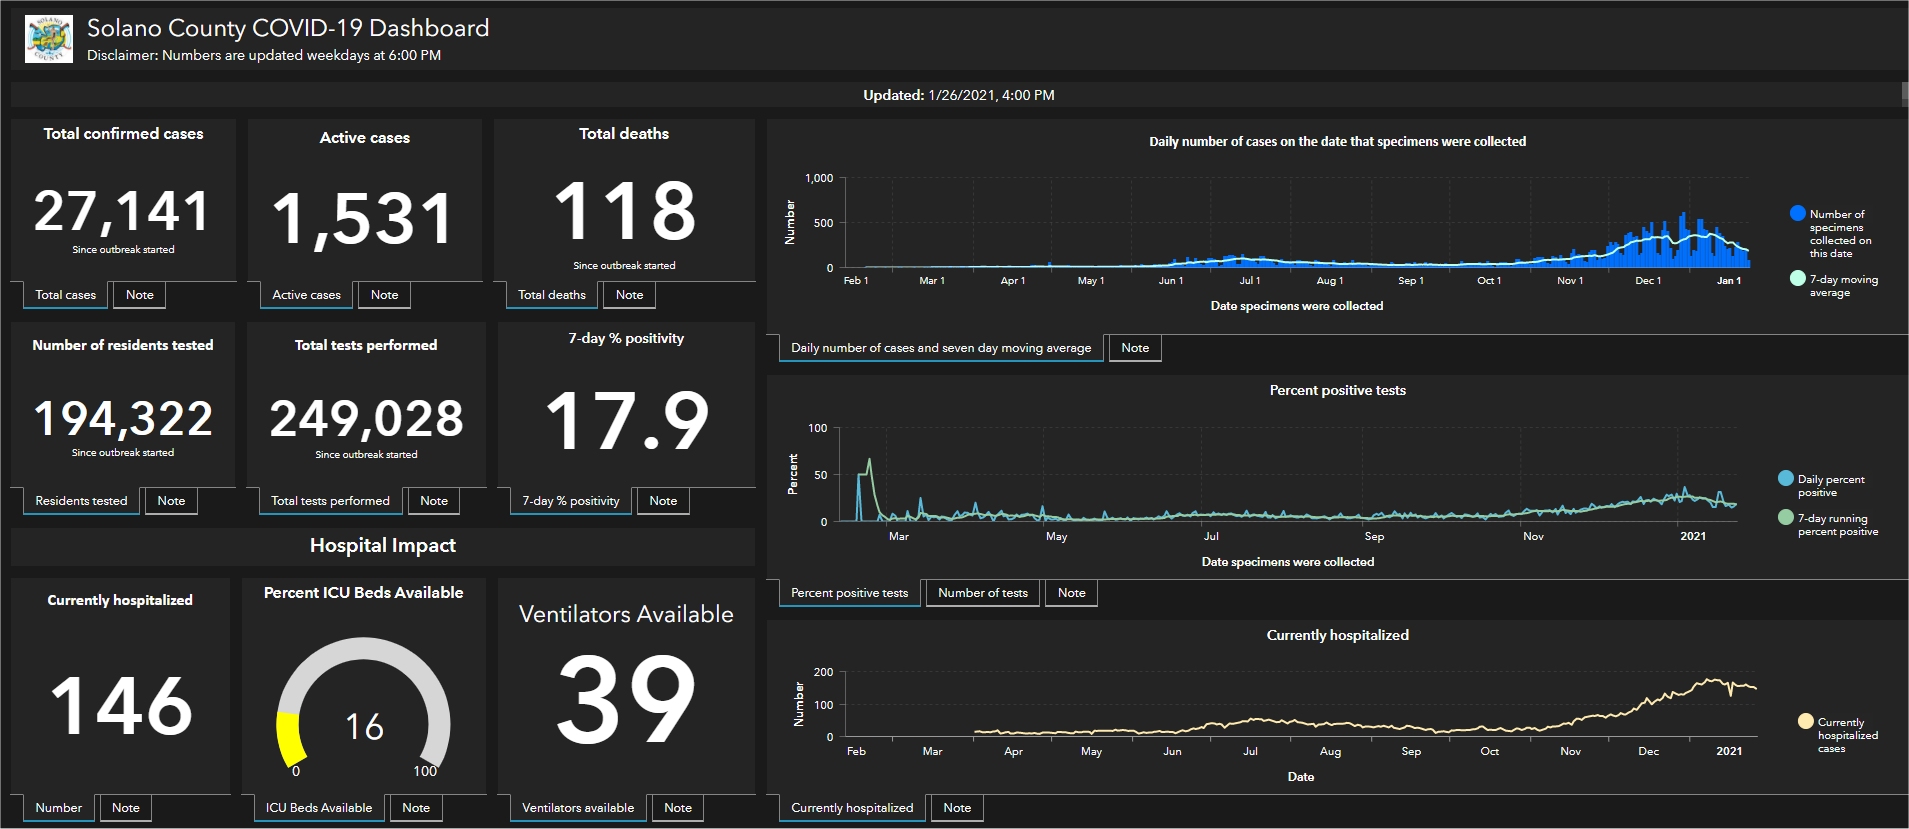
COMPARE: Screenshots from Solano County COVID Dashboard on Thursday, April 8:


The images on this page are from today’s and yesterday’s Solano County COVID-19 Dashboard.  The Dashboard is full of much more information and updated weekdays around 4pm.  On the County’s dashboard, you can hover a mouse or click on an item for more information.  Note the tabs at top for SummaryDemographics and Vaccines.  Click here to go to today’s Solano County Dashboard.


Sources

COVID numbers down in Solano, Benicia lowest infection rate, Dixon & Vacaville highest rates


By Roger Straw, Thursday, April 8, 2021

27 new COVID-19 cases overnight.  Still important to stay safe … ages 18-49 most likely to catch the virus.

Solano County COVID Dashboard on Thursday, April 8:Solano Cities – Benicia  has lowest RATE of infections, Dixon and Vacaville have highest infection rates.
[Source: see below.  See my ARCHIVE of daily Solano COVID data (excel).]
On April 8, Solano County reported 27 new COVID cases overnight, down from 51 last Thursday and 61 on last Friday.  Solano reported a total of 292 new cases last week, averaging 42 per day, keeping us from joining all other Bay Area counties in the State’s orange tier.
>> The virus is still on the move here.  Stay safe, get vaccinated, wear a mask and social distance!  We will get through this together.
Case rates/Hospitalization rates/Death rates by age group

Note that those of us age 18-49 are most likely to catch the virus.  The chart shows the rate of cases, hospitalizations and deaths in Solano County (per 100,000 population, as of today).  Click the image for better detail.

COMPARE: Screenshots from Solano County COVID Dashboard on Wednesday, April 7:

These images are from today’s and yesterday’s Solano County COVID-19 Dashboard.  The Dashboard is full of much more information and updated weekdays around 4pm.  On the County’s dashboard, you can hover a mouse or click on an item for more information.  Note the tabs at top for SummaryDemographics and Vaccines.  Click here to go to today’s Solano County Dashboard.

Sources

Benicia reaches 900 COVID cases – stay safe, get vaccinated!


By Roger Straw, Wednesday, April 7, 2021

30 new COVID-19 cases overnight.  Still important to stay safe … ages 18-49 most likely to catch the virus.

Solano County COVID Dashboard on Wednesday, April 7:
[Source: see below.  See my ARCHIVE of daily Solano COVID data (excel).]
On April 7, Solano County reported 30 new COVID cases overnight, down from 51 last Thursday and 61 on Friday.  Solano reported a total of 292 new cases last week, averaging 42 per day, keeping us from joining all other Bay Area counties in the State’s orange tier.
>> The virus is still on the move here.  Stay safe, get vaccinated, wear a mask and social distance!  We will get through this together.
Case rates/Hospitalization rates/Death rates by age group

Note that those of us age 18-49 are most likely to catch the virus.  The chart shows the rate of cases, hospitalizations and deaths in Solano County (per 100,000 population, as of today).  Click the image for better detail.

COMPARE: Screenshots from Solano County COVID Dashboard on Tuesday, April 6:

These images are from today’s and yesterday’s Solano County COVID-19 Dashboard.  The Dashboard is full of much more information and updated weekdays around 4pm.  On the County’s dashboard, you can hover a mouse or click on an item for more information.  Note the tabs at top for SummaryDemographics and Vaccines.  Click here to go to today’s Solano County Dashboard.

Sources

Solano County adds 31 new COVID cases today


By Roger Straw, Tuesday, April 6, 2021

31 new COVID-19 cases overnight.  Ages 18-49 most likely to catch the virus.

Solano County reported 31 new COVID cases overnight, down from 51 last Thursday and 61 on Friday.  Solano reported a total of 292 new cases last week, averaging 42 per day, keeping us from joining all other Bay Area counties in the State’s orange tier.  >> The virus is still on the move here.  Stay safe, get vaccinated, wear a mask and social distance!

Case rates/Hospitalization rates/Death rates by age group

Note that those of us age 18-49 are most likely to catch the virus.  The chart shows the rate of cases in Solano County (per 100,000 population, as of today).  Click the image for better detail.

FOR THE RECORD: Screenshots from Solano County COVID Dashboard on Tuesday, April 6:COMPARE: Screenshots from Solano County COVID Dashboard on Monday, April 5:

The screenshots above are from today’s and last Friday’s Solano County COVID-19 Dashboard.  The Dashboard is full of much more information and updated weekdays around 4pm.  On the County’s dashboard, you can hover a mouse or click on an item for more information.  Note the tabs at top for SummaryDemographics and Vaccines.  Click here to go to today’s Solano County Dashboard.

Sources