Category Archives: Covid 19

Vallejo’s Mare Island Ferry Taproom featured in SF Chronicle: Forget dining inside, going out to bars

Forget dining inside, going out to bars: California’s new surge restrictions could last for a long while

Cynthia Dizikes and Alexei Koseff July 2, 2020
Megan Keeton (right) sterilizes the patio furniture at the Mare Island Brewing Co. Ferry Taproom in Vallejo.
Megan Keeton (right) sterilizes the patio furniture at the Mare Island Brewing Co. Ferry Taproom in Vallejo.Photo: Photos by Nick Otto / Special to The Chronicle

New state restrictions on bars and restaurants in counties with the worst virus-control numbers are supposed to expire after three weeks. But few public health experts believe the bans on indoor gatherings and outdoor drinking will drop cases low enough for these activities to resume any time soon.

The dramatic move is the state’s attempt to rein in runaway case totals that have inched ever higher since some counties have begun allowing businesses to reopen and people have gathered more at home and outdoors.

But to really lower California’s surge in coronavirus infections — now at 246,735 — people need to curtail gatherings with friends and family and be more vigilant about wearing masks, particularly over the Fourth of July weekend, said UC Berkeley infectious disease expert Dr. John Swartzberg.

“This curve is going up very fast and it is going to take more than a nudge to bring it down again,” Swartzberg said, referring to Gov. Gavin Newsom’s order to shut down several recently reopened sectors that the state has identified as riskiest for transmission of the virus.

The order requires restaurants, wineries, tasting rooms, family entertainment centers, movie theaters, museums, zoos and cardrooms to halt indoor operations for at least three weeks. Outdoor operations, such as restaurant patios, are still allowed. But Newsom also ordered the closure of all bars and breweries in the 19 counties, including those outdoors, unless they also serve sit-down meals. The new restrictions will impact nearly 75% of California’s population of 39.5 million people.

The California Department of Public Health did not respond to questions about what would happen in three weeks and whether counties would be free to reopen all of those businesses.

At his news briefing Thursday, Newsom said he was confident the new restrictions will help keep new cases in check.

“We tempered the growth of the curve,” he said. “We need to do that again.”

Those assurances didn’t make it any easier, however, for businesses that had to roll back reopenings.

Beth Stine, Art Stine, and Serena Salvan eat lunch on the rooftop patio at Mare Island Brewing Co. Ferry Taproom.
Beth Stine, Art Stine, and Serena Salvan eat lunch on the rooftop patio at Mare Island Brewing Co. Ferry Taproom. Photo: Nick Otto / Special to The Chronicle

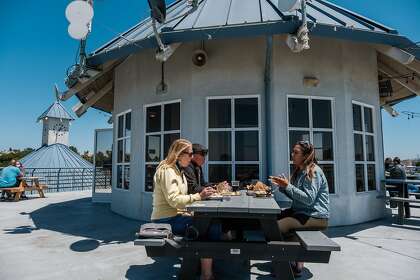
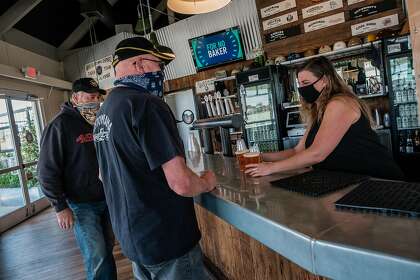
At the Mare Island Brewing Co. Ferry Taproom in Vallejo, business was finally returning to some semblance of normal this summer. People had returned to drink and dine indoors and out. Nearly all of the 44-person staff had been rehired.

But then, on Wednesday, co-owner Kent Fortner’s phone lit up with messages: Solano County, where the tap room is, was among the 19 counties in the shutdown order, as were Contra Costa and Santa Clara counties in the Bay Area.

“It was really a kick in the teeth,” Fortner said. “As a business owner I can manage a downturn. It is uncertainty that kills a business. This came with no notice whatsoever, three days before a holiday weekend.”

Short of shutting down, closing bars and banning indoor gatherings in restaurants can be particularly effective as an isolated measure, said Dr. Thomas Tsai, a surgeon and health policy expert at the Harvard T.H. Chan School of Public Health.

Tsai and other researchers at Harvard and Google analyzed anonymized cell phone data from the first part of the year and found that closing bars and restaurants was the best way to keep people from venturing out of their homes — better than bans on large gatherings, school closures and shuttering other nonessential businesses.

“What California is doing makes sense,” Tsai said. “It is not that bars and restaurants are inherently dangerous but the nature of social interactions and socializing that come part and parcel with a restaurant or bar increases opportunities for the virus to spread.”

Coronavirus infections throughout the Bay Area grew to 27,158 Thursday with 590 deaths, county data showed. Single-day spikes in Bay Area counties included 178 new cases in Santa Clara, 228 in Alameda and 78 in Contra Costa.

Across California, the number of infections rose to 246,594 Thursday, with 6,261 deaths.

As of Wednesday, California joined 12 other states classified as “orange” on the risk scale developed by Harvard and a collaboration of scientists. Orange indicates escalating community spread. Stay-at-home orders may be necessary, unless it’s possible to increase testing and tracing. Three states, Arizona, Florida and South Carolina, were classified as “red,” meaning that community spread was unchecked and stay-at-home orders were necessary.

Newsom has pushed back on the notion that the state reopened too quickly. During press briefings, he has repeatedly asserted that his administration merely developed guidelines for how to safely operate different sectors of the economy, leaving it up to counties to determine a timeline for when they would resume based on local conditions.

On Thursday, he said his strategy for the counties that had been forced to toggle back their reopenings was “more targeted education,” rather than punitive measures.

He suggested that the surge in new cases was a failure of individual behavior, not public policy.

“I think the most important thing we’ve learned over the course of the last number of months,” Newsom told reporters, “is so often the conversation and the questions were about when, not how. We need to have a deeper conversation about how to safely reopen.”

The governor pointed to a public awareness campaign that his administration launched Thursday, with ads encouraging people to wear masks set to go up on television, radio, social media and billboards.

Phil Lang and Steven Morgan collect their beers before heading out onto the patio at Mare Island Brewing Co. Ferry Taproom in Vallejo.
Phil Lang and Steven Morgan collect their beers before heading out onto the patio at Mare Island Brewing Co. Ferry Taproom in Vallejo. Photo: Nick Otto / Special to The Chronicle

The governor’s order applies to counties that have spent at least three consecutive days on a state watch list because of their high rate of new infections, positive tests or increasing hospitalizations. Outside of the Bay Area, the affected counties include Fresno, Glenn, Imperial, Kern, Kings, Los Angeles, Merced, Orange, Riverside, Sacramento, San Bernardino, San Joaquin, Santa Barbara, Stanislaus, Tulare and Ventura.

Some of the counties affected by the governor’s order had not reopened indoor dining or drinking, including Santa Clara.

On Thursday, Santa Clara County issued a new health order allowing some activities to resume, including hair and nail services, gyms, and small gatherings if social distancing protocols are in place. The order also requires employers to immediately report coronavirus cases on their staff for all employees who were at work within two days of having symptoms or of being tested. Employers must report the case within four hours to the public health department.

Also this week, the Contra Costa Health Services department encouraged people to avoid gatherings of friends and family, wear masks, and seek testing even if they had no symptoms.

Solano County had moved more quickly than other counties to reopen, allowing indoor dining in May and reopening retail stores, tattoo parlors, museums and nail salons, among other businesses. The county has drafted a new order to reflect the governor’s restrictions.

However, county health officer Dr. Bela Matyas said Thursday that he was not optimistic the new rules would help drop the rising number of cases in his county. Matyas said that most of the increases can be attributed to people getting together at home with their friends and families. While a handful of outbreaks have been linked to work sites, he said Solano has not seen any cases tied to restaurants or bars.

“We don’t have any evidence that this is how the disease is spreading in our county,” Matyas said. “People find it easy to blame the business sector, but at least in our county, it is what we are doing at home that is causing the spread.”

For now, Fortner has closed the indoor dining area at the taproom, which is also a restaurant. But, he said, he worries about what the future holds for his small business and others.

“I want my kids to go to school in the fall and I want to be part of the solution instead of the problem,” he said. “But the lack of clarity, transparency and advanced notice is very frustrating.”


Cynthia Dizikes and Alexei Koseff are San Francisco Chronicle staff writers.

Solano County sees 74 new COVID-19 cases today


Thursday, July 2: 74 new cases today,
no new deaths. Since the outbreak started: 1,476 cases, 105 hospitalized, 25 deaths.

Compare previous report, Wednesday July 1:Summary

  • Solano County reported 74 new cases today, total of 1,476 cases since the outbreak started.  Over the last 7 days, Solano reported 382 new cases, an average of 55 per day.
  • No new deaths today, total of 25. 1 fewer currently hospitalized, total of 41, but 1 more total hospitalized since the outbreak started, total of 105.
  • Solano reported 62 more ACTIVE cases today, total of 369.  This figure has been climbing all week: from 70 on Monday, to 209 Tuesday, 307 Wednesday and 369 today.
  • ICU beds Available remained at 32%.  Ventilators Available dropped from 92% to 90%.
  • Testing – Solano County reported 558 residents were tested since yesterday, total nearing 32,000.  We still have a long way to go: only 7% of Solano County’s 447,643 residents (2019) have been tested.

Details and Demographics tab

The County’s Public Health Dashboard includes a second tab (panel), “Details and Demographics” (shown here).  Note that the Summary tab and this Details tab are both user interactive – hover over a chart (or tap) to get details. On this Details tab, most of the small charts have a small additional tab showing the rate per 100,000.   Go there and explore the two tabs.  (Expand a chart by clicking the small button in its upper right corner.)

BY AGE GROUP

  • Youth 17 and under – 6 new cases today, total of 132 cases, only one ever hospitalizedTwo weeks ago, there were only 57 cases among this age group – we’ve seen 75 new cases in 14 days!  I continue to be alarmed for Solano’s youth.  Cases among Solano youth have increased in recent weeks to 9% of the 1,476 total confirmed cases.
  • Persons 18-49 years of age – 57 new cases today, total of 862 cases.  This age group represents 58% of the 1,476 total cases, by far the highest percentage of all age groups.  The County reported 1  new hospitalization among this age group today, and no new deaths.  Total of 28 hospitalized at one time and 2 deaths.
  • Persons 50-64 years of age – 8 new cases today, total of 290 cases.  This age group represents 20% of the 1,476 total casesNo new hospitalizations today, total of 35 hospitalized at one time.  No new deaths, total of 3 deaths.
  • Persons 65 years or older – 3 new cases today, total of 191 cases.  This age group represents 13% of the 1,476 total cases.  No new hospitalizations, total of 41 hospitalized at one time.  No new deaths, total of 20 deaths.  In this older age group, 21% were hospitalized at one time, a substantially higher percentage than in the lower age groups And this group counts for 20 of the 25 deaths, or 80%.

CITY DATA

  • Vallejo added 24 new cases today, total of 558.
  • Fairfield added 27 new cases today, total of 489.
  • Vacaville added 11 new cases today, total of 211 cases.
  • Suisun City added 3 new cases today, total of 92 cases.
  • Benicia added 2 new cases today, total of 29 cases.
  • Dixon added 6 new case today, total of 76 cases.
  • Rio Vista added 1 new case, total of 15 cases.
  • Unincorporated areas – Although the County still still shows Unincorporated at <10 (less than 10), a little math tells the story: Solano’s unincorporated areas remained at 6 cases, unaccounted for in the other City totalsResidents and city officials have long pressured County officials for full and transparent city case counts.  Finally we have complete city data for ALL areas of the County!
  • A “Rate” column shows the rate of positive COVID-19 cases (per 100,000 population) for each city.  Benicia is leading the way here, with a rate of only 105.2 cases per 100,000. Compare with other Solano cities in the chart, and note that the CDC reports today’s rate in California at 588 per 100,000 (up from 566 yesterday).  Johns Hopkins lists the overall Solano County rate at 314 (unchanged, as it reflects incomplete data for yesterday).

RACE / ETHNICITY

The County report on race / ethnicity data includes case numbers, hospitalizations, deaths and Solano population statistics.  There are also tabs showing a calculated rate per 100,000 by race/ethnicity for each of these boxes.  This information is discouragingly similar to national reports that indicate worse outcomes among black and brown Americans.  As of today:

  • White Americans are 39% of the population in Solano County, but only account for 23% of cases, 22% of hospitalizations and 21% of deaths.
  • Black Americans are 13% of Solano’s population, and account for 13% of cases, but 28% of hospitalizations, and 38% of deaths.
  • Latinx Americans are 26% of Solano’s population, but account for 37% of cases.  They account for 26% of hospitalizations, and 17% of deaths.
  • Asian Americans are 14% of Solano’s population, and account for 11% of cases and 15% of hospitalizations, but 21% of deaths.

MUCH MORE…

The County’s new and improved Coronavirus Dashboard is full of much more information, too extensive to cover here on a daily basis.  The Benicia Independent will continue to summarize daily and highlight a report or two.  Check out the Dashboard at https://doitgis.maps.arcgis.com/apps/MapSeries/index.html?appid=055f81e9fe154da5860257e3f2489d67.

COVID-19 cases in Solano County up sharply again, with one new death


Wednesday, July 1: 114 new cases today,
1 new death. Since the outbreak started: 1,402 cases, 104 hospitalized, 25 deaths.

Compare with previous report, Tuesday June 30:Summary

  • Solano County reported 114 new cases today, total of 1,402 cases since the outbreak started.  Over the last 7 days, Solano reported 338 new cases, an average of 48 per day.
  • 1 new deaths today, total of 25, 2 more hospitalized, total of 41 currently, 104 since the outbreak started.
  • Solano reported 98 more ACTIVE cases today, total of 307.  This figure has been on a yoyo this week.  For whatever reason, 250 last Friday, only 70 on Monday, back up to 209 yesterday and 307 today.  An increasing number, no matter how you look at it….
  • Note the drop in ICU beds Available, from 37% to 32%.  Need to keep an eye on this one.
  • Testing – Solano county reported 831 residents were tested since yesterday.  Good progress!

Details and Demographics tab

The County’s new Public Health Dashboard design includes a second tab (panel), “Details and Demographics” (shown here).  Note that both tabs are user interactive – hover over a chart (or tap) to get details. On this Details/Demographics tab, most of the small charts have a small additional tab showing the rate per 100,000.   Go there and explore the two tabs.  (Expand a chart by clicking the small button in its upper right corner.)

SEVEN DAY MOVING AVERAGE

Yesterday’s Seven Day moving average of confirmed cases showed an uptick (see at right).  Today’s chart is back to its misleading look, supposedly tracking as a 7-day average the increase of 717 cases (!) we have seen in the last 2 weeks…

Don’t let these “smoothed out” charts fool you – cases are up dramatically here.  Masks and social distancing are still required and important!  Today’s chart shows a 7-day moving average of 21 new cases per day, supposedly down from 27 in yesterday’s report.

BY AGE GROUP

  • Youth 17 and under – 15 new cases today, total of 126 cases, only one ever hospitalizedTwo weeks ago, there were only 52 cases among this age group – we’ve seen 74 new cases in 14 days!  I continue to be alarmed for Solano’s youth.  Cases among Solano youth have increased in recent weeks to 9% of the 1,402 total confirmed cases.
  • Persons 18-49 years of age – 66 new cases today, total of 805 cases.  This age group represents 57% of the 1,402 total cases, by far the highest percentage of all age groups.  The County reported no new hospitalizations among this age group today, and no new deaths.  Total of 27 hospitalized at one time and 2 deaths.
  • Persons 50-64 years of age – 22 new cases today, total of 282 cases.  This age group represents 20% of the 1,402 total casesNo new hospitalizations today, total of 35 hospitalized at one time.  No new deaths, total of 3 deaths.
  • Persons 65 years or older – 11 new cases today, total of 188 cases.  This age group represents 13% of the 1,402 total cases.  No new hospitalizations, total of 41 hospitalized at one time.  1 new death, total of 20 deaths.  In this older age group, 22% were hospitalized at one time, a substantially higher percentage than in the lower age groups And this group counts for 20 of the 25 deaths, or 80%.

CITY DATA

  • Vallejo added 28 new cases today, total of 534.
  • Fairfield added 39 new cases today, total of 462.
  • Vacaville added 17 new cases today, total of 200 cases.
  • Suisun City added 8 new cases today, total of 89 cases.
  • Benicia added 1 new case today, total of 27 cases.
  • Dixon added 19 new case today, total of 70 cases.
  • Rio Vista was reported greater than 10 cases for the first time today, showing a total of 14 cases.  (The other cities added up to 112 of today’s 114 new cases, so… supposedly Rio Vista must have added 2 new cases.  Perhaps the County failed to note Rio Vista as >10 yesterday?)
  • Unincorporated areas – Although the County still still shows Unincorporated at <10 (less than 10), a little math tells the story: Solano’s unincorporated areas must account for the 6 cases unaccounted for in the other City totalsResidents and city officials have long pressured County officials for full and transparent city case counts.  Finally we have complete city data for ALL areas of the County!
  • A “Rate” column shows the rate of positive COVID-19 cases (per 100,000 population) for each city.  Benicia is leading the way here, with a rate of only 97.9 cases per 100,000. Compare with other Solano cities in the chart, and note that the CDC reports today’s rate in California at 566 per 100,000 (up from 547 yesterday).  Johns Hopkins lists the overall Solano County rate at 252 (unchanged, as it reflects incomplete data for yesterday). UPDATE: Johns Hopkins updated its listing for cases per 100,000 in Solano County to 314 (a significant jump, up from 252 on Tuesday).

RACE / ETHNICITY

The County report on race / ethnicity data includes case numbers, hospitalizations, deaths and Solano population statistics.  There are also tabs showing a calculated rate per 100,000 by race/ethnicity for each of these boxes.  This information is discouragingly similar to national reports that indicate worse outcomes among black and brown Americans.  As of today:

  • White Americans are 39% of the population in Solano County, but only account for 24% of cases, 22% of hospitalizations and 21% of deaths.
  • Black Americans are 14% of Solano’s population, and account for 13% of cases, but 29% of hospitalizations, and 38% of deaths.
  • Latinx Americans are 26% of Solano’s population, but account for 37% of cases.  They account for 25% of hospitalizations, and 17% of deaths.
  • Asian Americans are 14% of Solano’s population, and account for 11% of cases and 15% of hospitalizations, but 21% of deaths.

MUCH MORE…

The County’s new and improved Coronavirus Dashboard is full of much more information, too extensive to cover here on a daily basis.  The Benicia Independent will continue to summarize daily and highlight a report or two.  Check out the Dashboard at https://doitgis.maps.arcgis.com/apps/MapSeries/index.html?appid=055f81e9fe154da5860257e3f2489d67.

Benicia Firefighter Tests Positive for COVID-19

CITY OF BENICIA
Benicia Fire Department
250 East L Street,
Benicia, California 94510

Contact: Fire Chief Josh Chadwick
Benicia Fire Department
(707) 746-4275
jchadwick@ci.benicia.ca.us

CITY OF BENICIA UPDATE ON COVID-19
Benicia Firefighter Tests Positive for COVID-19

Benicia, CA (July 1, 2020) — On July 1, 2020, a Benicia Fire Department firefighter informed the City of Benicia that they received a positive test result for COVID-19. The source of the infection has not yet been determined, but the Benicia Fire Department is working with the Solano County Public Health Department to attempt to determine the source.

Fire Chief Josh Chadwick has been in close contact with Solano County Public Health staff who have determined that, based on the firefighter’s last shift on duty and the date of onset of symptoms, there was no exposure to City staff or to the community during the firefighter’s infectious period.

“We are fortunate that during the period of infection, the firefighter was not present in the City of Benicia. The Benicia Fire Department is committed to preventing the spread of COVID-19 and ensuring the safety of the residents of Benicia,” said Benicia Fire Chief Josh Chadwick.

The Benicia Fire Department has standing operating guidelines and county protocols in place to limit or prevent the infection between patients and fire personnel. Fire personnel follow these guidelines and protocols during treatment and interaction with residents. The firefighter had no fever or symptoms during their last on-duty shift. The affected Firefighter is in self-quarantine at home and has not required hospitalization.

All Benicia fire stations remain fully staffed and the City does not anticipate any disruption to service delivery.

Due to health privacy rights, the City is prohibited from providing any information about the identity of the affected firefighter.

For up-to-date information about the City of Benicia’s response to COVID-19, please go to https://www.ci.benicia.ca.us/coronavirus.

###