
Community Members Advocating for Racial Justice and Systemic Change
Benicia Magazine, by Gethsemane Moss Ed.D, February 1, 2021
“You are growing into consciousness, and my wish for you is that you feel no need to constrict yourself to make other people comfortable.”
― Ta-Nehisi Coates, Between the World and Me
The creation of the Benicia Black Lives Matter (BBLM) community organization was formed after the death of George Floyd, an incident witnessed by millions of people across the United States and world. Floyd’s passing was a tipping point that stirred up past and present negative emotions for many. For some people of color, it was a harsh reminder of a different reality of navigating systems met with dimensions of positionality dealing with race, gender, and socio-economic disparities within communities and the linkage of policy, education, economic opportunities, and access.
The founder of BBLM, Nimat Shakoor-Grantham acted and sparked a community conversation to shed light on her experience as a Black woman in Benicia and to raise awareness about the experiences of other Black community members as well. “We aim to raise the awareness for the citizens of Benicia about the biases that happen in town and how it impacts the Black residents of Benicia,” says Shakoor-Grantham. Shakoor-Grantham goes on to share, “The main objective is to bring Benicia closer together in an authentic way; not by saying I don’t see color and everything is good. Benicia is a beautiful place but has an ugly underside that needs to be addressed.”
The BBLM community organization has core teams: City Government Action Team, Education Action Team, Cultural Arts Action Team, Awareness Team, and the New Member Committee. BBLM members include a diverse group of residents who are parents, retirees, business owners, lawyers, doctors, specialized licensed professionals, and recent Benicia High School graduates now attending college. All are dedicated to working with local Benicia leaders in shaping systems and policies that present every Black person and other marginalized groups, the social, economic, creative, and political power to thrive.
Education Action Team member and Benicia High School graduate, La Paula Parker shared, “Being a Black young woman in Benicia is very difficult and exhaustive at times. BBLM is significant because it requires Benicia to wake up and actually acknowledge the reality of our community and the larger world.” Parker goes on to say “education is one of the best ways for us to grow as a community. Education at its core allows us to understand one another, empathize, and love each other. I hope to better incorporate ethnic studies curriculum into the Benicia school system.”
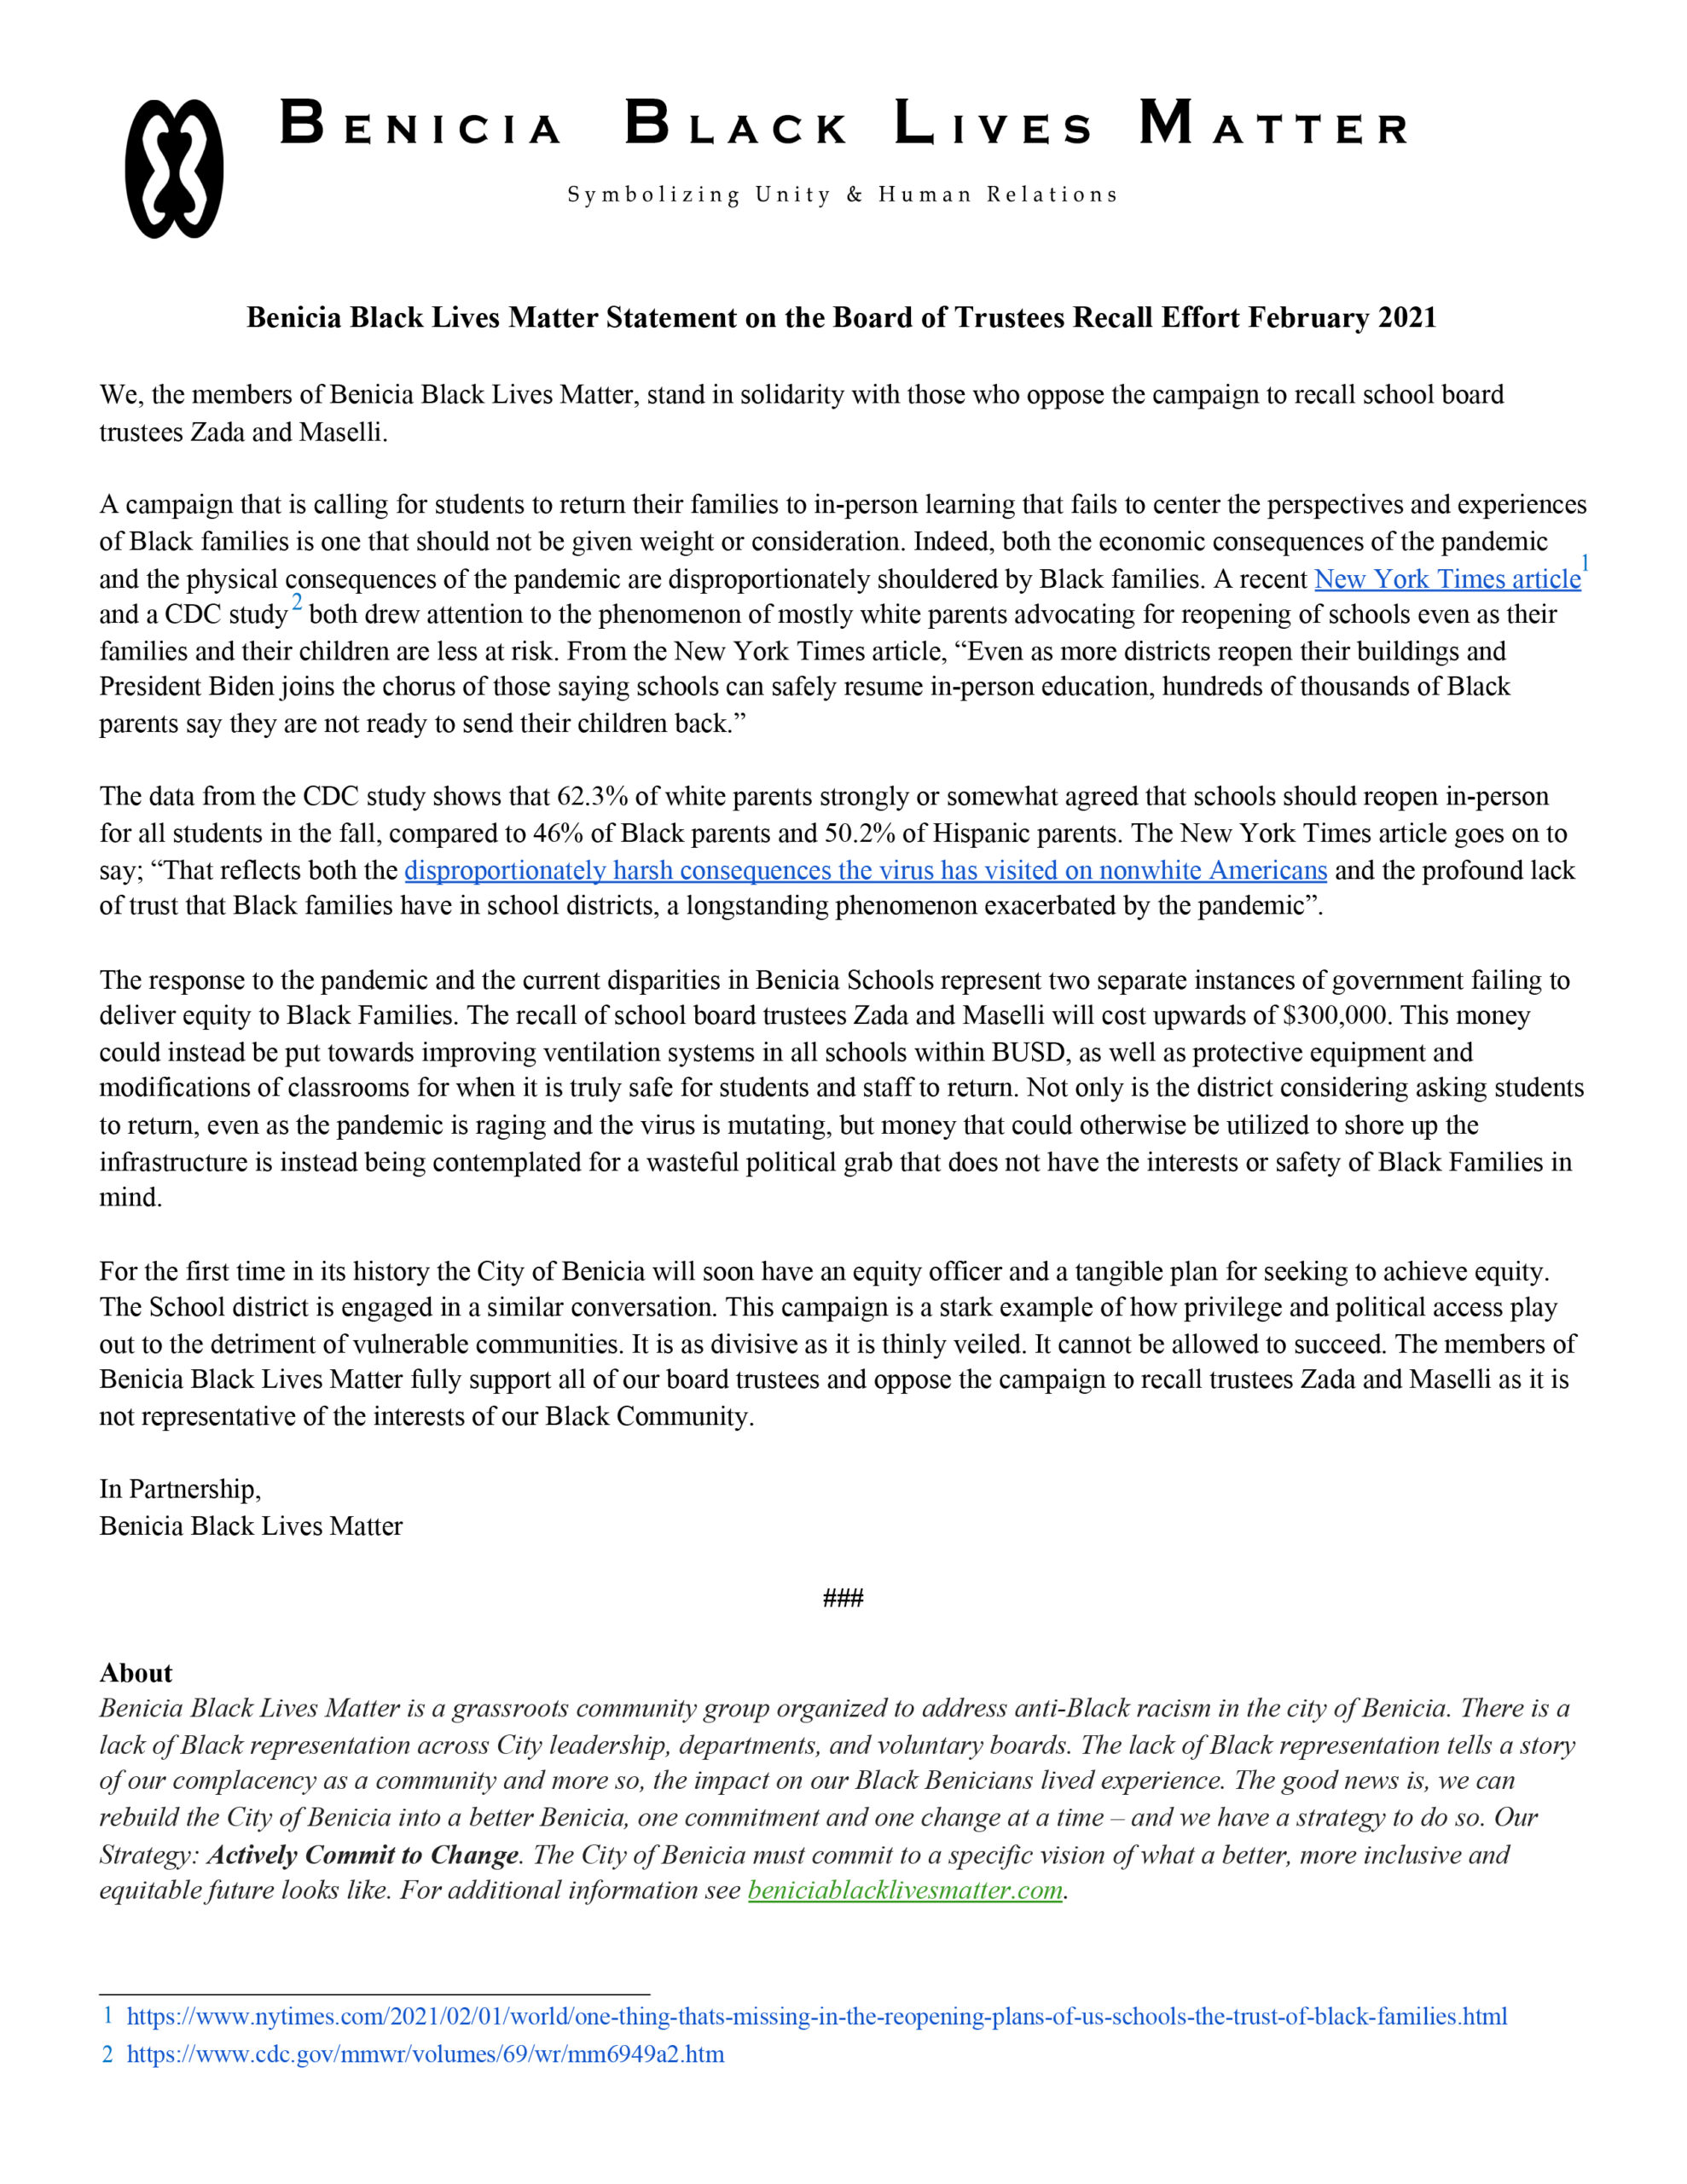
Benicia High School graduate, Branden Ducharme, was one of the BBLM team members who made a presentation at the Benicia City Council, resulting in the passing of Resolution 20. Ducharme states, “BBLM is responsible, with the help of Benicia’s city council, for the passing of Resolution 20, which included many great things, the most notable being the creation of an Equity and Diversity Manager position within the city. When asked about the connection to the National Black Lives Matter Organization Ducharme shared, “I can assure you that whatever negative assumptions you may have about us or our agenda are probably far from the reality of our work. BBLM is tailored to Benicia in two main ways. The first is that it is a grassroots organization with currently no official affiliation with other BLM organizations, though we do value many of the same principles. The second being that every single member as of right now is either a current Benicia resident or has been one in the past.”
BBLM is providing Professional Development that started in January 2021 and extends through March. The workshop series, Showing up for Racial Justice (SURJ), takes participants on a journey to examine the history of white supremacy and resistance movements. The workshop aims to help build the attendee’s ability to effectively act and advocate on behalf of social justice. This free training series was open to members of the Benicia community. BBLM also partnered with the Benicia Library and has established a Black Lives Matter Collection curated reading list.
You can reach out to Benicia Black Lives Matter social media or email them at the following:
- Twitter: @beniciablm https://twitter.com/beniciablm
- Instagram: @beniciablacklivesmatter https://www.instagram.com/beniciablacklivesmatter/
- Facebook: @beniciablm https://www.facebook.com/BeniciaBLM
- Website: https://beniciablacklivesmatter.weebly.com/
- Email: admissionsbblm@gmail.com


You must be logged in to post a comment.