
UPDATE: See today’s latest information
Solano COVID report: 2 of us died, and over 70 developed new cases today. Number of active cases nearing 400. It’s still among us, folks – stay safe!
Solano County COVID report on Friday, April 16:
[Source: see far below. See also my ARCHIVE spreadsheet of daily Solano COVID updates.]Solano County COVID-19 Dashboard – SUMMARY:

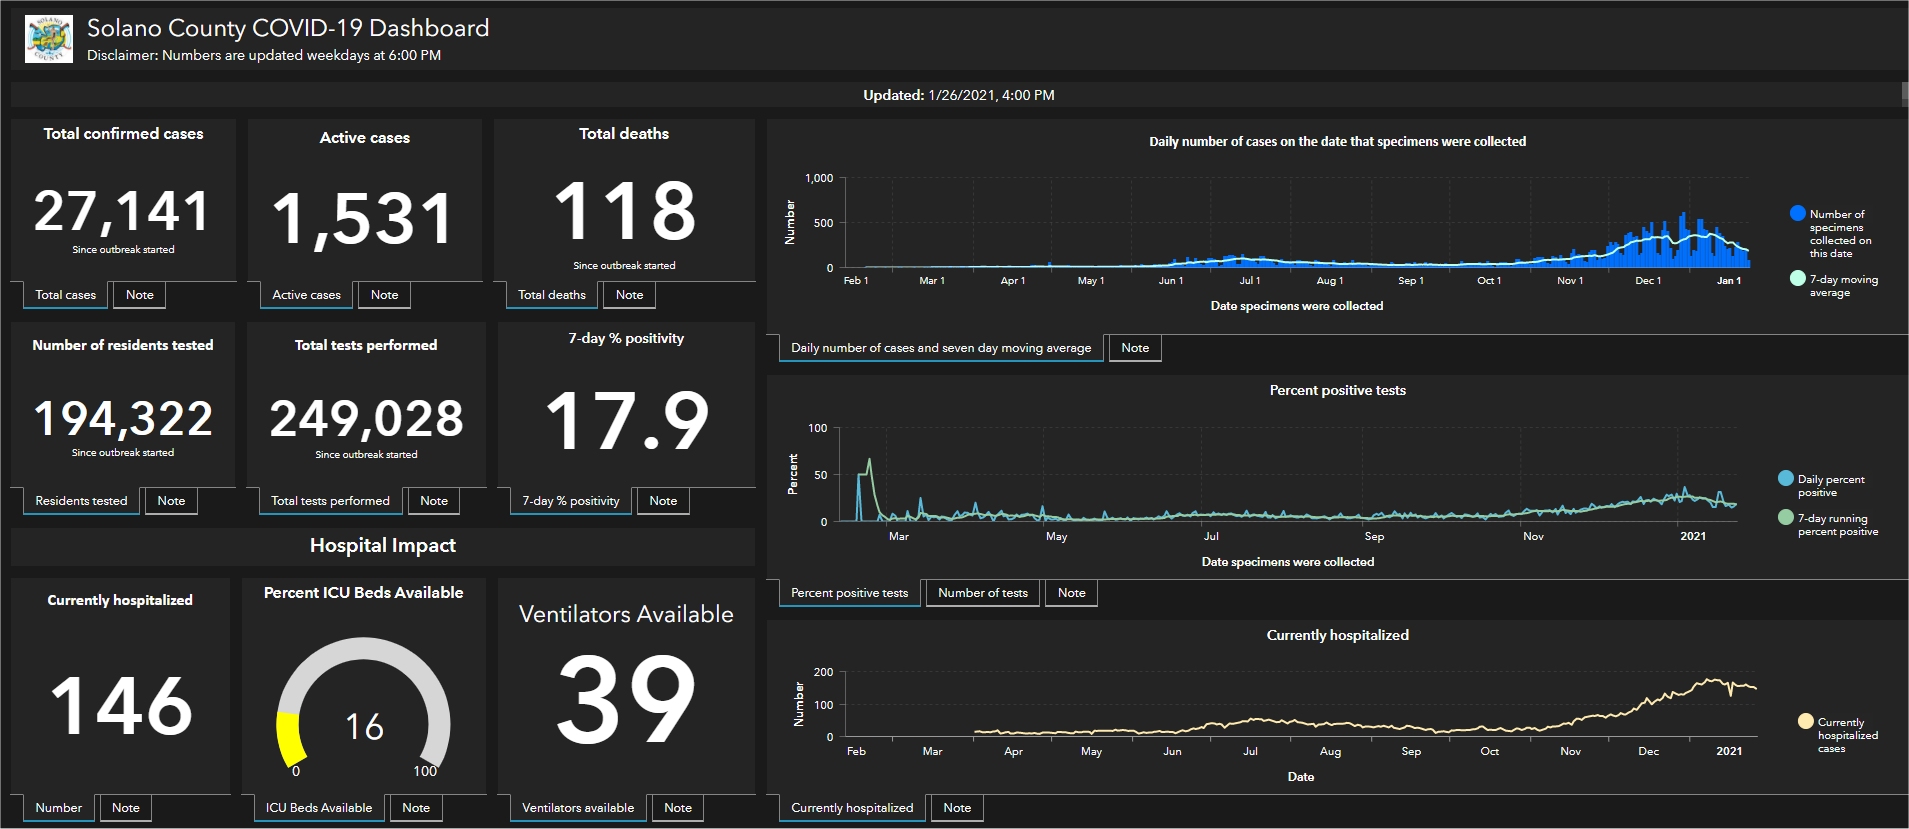
On April 16, Solano County reported 2 deaths, both over 65 years, and the County reported 71 new COVID cases. For context, our average over the first two weeks of April was 39 new cases per day. The increase of 70 yesterday and 71 today will make it more difficult for Solano to join all other Bay Area counties in the State’s orange tier. Solano’s Currently Active cases increased today from 347 to 373. Our percent positivity rate fell slightly from 6.3% to 6.2%.
>> The virus is still on the move here. Stay safe, get vaccinated, wear a mask and social distance! We will get through this together.
>> The virus is still on the move here. Stay safe, get vaccinated, wear a mask and social distance! We will get through this together.
Cases by City on April 16:

- Benicia added 1 new case today, total of 915 cases since the outbreak began.
- Dixon added 2 new cases today, total of 1,837 cases.
- Fairfield added 20 new cases today, total of 8,671 cases.
- Rio Vista remained steady today, total of 358 cases.
- Suisun City added 6 new cases today, total of 2,180 cases.
- Vacaville added 17 new cases today, total of 8,313 cases.
- Vallejo added 25 new cases today, total of 9,500 cases.
- Unincorporated areas remained steady today, total of 101 cases.
Most new cases are among those of us age 18-49! Please stay safe, and if you catch it, please don’t pass it on to your elders!
| Solano Age Groups – Total & New Cases reported today | |||||||
| 0-17 Total Cases | New cases today | 18-49 Total Cases | New cases today | 50-64 Total Cases | New cases today | 65+ Total Cases | New cases today |
| 3,796 | 19 | 17,648 | 37 | 6,590 | 10 | 3,830 | 5 |
Ages 0-17 count for 11.9% of all cases
Ages 18-49 count for 55.4% of all cases
Ages 50-64 count for 20.7% of all cases
Ages 65+ count for 12.0% of all cases
The chart below shows the RATE of Solano cases by age groups (per 100,000 population, as of today).
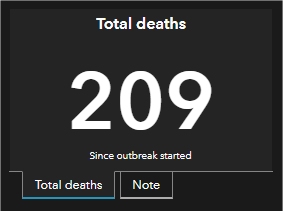
COMPARE: Screenshots from Solano County COVID Dashboard yesterday, Thursday, April 15:


The images on this page are from today’s and the previous Solano County COVID-19 Dashboard. The Dashboard is full of much more information and updated weekdays around 4pm. On the County’s dashboard, you can hover a mouse or click on an item for more information. Note the tabs at top for Summary, Demographics and Vaccines. Click here to go to today’s Solano County Dashboard.[sta_anchor id=”sources” /]
Sources
- Solano County Coronavirus Dashboard (posted on the County website today).
- The State of California’s Open Data Profile at COVID19.CA.GOV
- See also on the BenIndy: Hospitalizations AND ICU Beds by REGION.
- See also my ARCHIVE of daily Solano COVID updates (an excel spreadsheet).
You must be logged in to post a comment.