Tag Archives: count

COVID-19 in Benicia and Solano County: Encouraging, but still on the move

NOTE: The information below is not the latest.  TAP HERE for today’s latest information.

By Roger Straw, Wednesday, March 2, 2022

Solano County reported 96 new COVID infections since last Friday.  Benicia’s 7-day case count remains in SUBSTANTIAL transmission rate, but only 1 case above MODERATE.  Solano County continues in HIGH transmission rate, but is nearing SUBSTANTIAL.

Solano Public Health COVID dashboard, Wednesday, March 2, 2022:

NOTE: Solano County Public Health will update its COVID Dashboard ONLY ON MONDAYS & THURSDAYS as of March 14, 2022

DEATHS:  Solano reported no new deaths in today’s report. Trending: Fifteen new deaths were reported in February, ALL over 65 years of age.  We can’t be sure this is a final number because the County often post-dates deaths and hospitalizations. Still, it’s encouraging.  Until February, the County saw increasing COVID-related deaths each month since last November, rising to 30 in January.  A total of 396 Solano residents have now died of COVID or COVID-related causes over the course of the pandemic.

CASES BY AGE GROUP: The color-coded chart (below) shows an alarming steady increase among youth and children in Solano County.  The chart displays quarterly and recent snapshots in time by age group, each as a percentage of total cases since the outbreak began.  Increases are in red and decreases are in green as reported by Solano County.  Note the continuing increase among children & youth of Solano County.  The population of those age 0-17 in Solano County is roughly 22%.
TRANSMISSION RATE: Solano is still experiencing a HIGH transmission rate, with a total of 514 new cases over the last 7 days. Encouraging: this is down from 1,126 at last report, and approaching the CDC’s SUBSTANTIAL rate for the first time since December 22 of last year.
  CDC FORMULA: Based on Solano County’s population, 450 or more cases in 7 days places Solano in the CDC’s population-based definition of a HIGH transmission rate.  We would need to drop below 225 cases in 7 days to rate as having only MODERATE community transmission.

ACTIVE CASES: Solano reported 544 ACTIVE cases today, down from 604 at last report, still almost double the County’s 329 active cases on December 1.

CASES BY CITY – Wednesday, March 2, 2022:

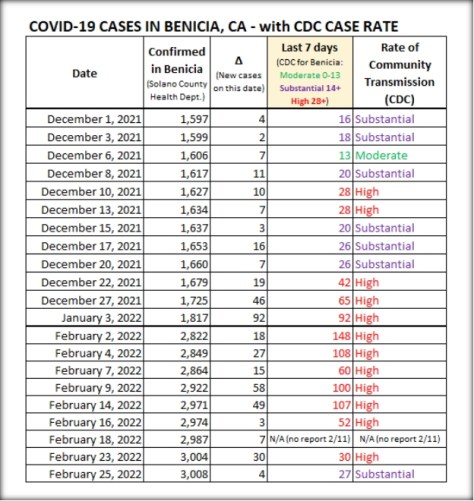
  • BENICIA added 10 new cases since last Friday, a total of 3,018 cases since the outbreak began.  TRANSMISSION RATE: **Benicia has seen only 14 new infections in the last 7 days, just barely remaining in the CDC’s SUBSTANTIAL rate of transmission.  Only one fewer case will drop Benicia into the desired MODERATE rate of transmissionFor a city with Benicia’s population, anything over 27 cases in 7 days is considered HIGH TRANSMISSION. (See chart below.)

  • Dixon added 15 new cases since last Friday, total of 4,148 cases.
  • Fairfield added 71 new cases since last Friday, total of 21,241 cases.
  • Rio Vista added 4 new cases since last Friday, total of 1,071 cases.
  • Suisun City added 16 new cases since last Friday, total of 5,585 cases.
  • Vacaville added 58 new cases since last Friday, a total of 19,426 cases.
  • Vallejo added 107 new cases since last Friday, a total of 24,860 cases.
  • Unincorporated added 0 new cases today, a total of 191 cases.

TEST RATE:  Solano County’s 7-Day Percent Positive Test Rate shot up after Christmas and has continued through last week’s very high 13%, but fell dramatically this week to only 8% today. Even at this lower rate, SOLANO DOES NOT COMPARE FAVORABLY: The CALIFORNIA 7-day % positive rate fell today from 3.2% to only 2.5%[Source: Johns Hopkins Coronavirus Tracking CenterAND the U.S. 7-day % positive rate fell today from 5.3% to only 4.1%. [Source: CDC COVID Data Tracker.] 

HOSPITALIZATIONS:

CURRENT The number of those currently hospitalized with COVID in Solano County rose today from 39 to 45 persons.  Current hospitalizations don’t tell the whole story, as it reflects both admissions and discharges.  Only from the increase in total hospitalizations can we know how many new admissions have come to our hospitals.

TOTAL hospitalizations over the course of the pandemic – Solano County’s total hospitalized must be independently discovered in the County’s occasional update of hospitalizations by Age Group and by Race/Ethnicity.  Solano Public Health has not updated its Age Group and Race/Ethnicity charts since February 18.  Our known total since the beginning of the outbreak (as of Feb 18) was 3,693 Solano residents hospitalized.

ICU Bed Availability in Solano County rose today from 24% to 27%, still in the Yellow danger zone.

Ventilator Availability  improved today from 66% to 71% available


HOW DOES TODAY’S REPORT COMPARE?  See recent reports and others going back to April 20, 2020 in my ARCHIVE of daily Solano COVID updates (an excel spreadsheet).


>The data on this page is from the Solano County COVID-19 Dashboard.  The Dashboard is full of much more information and updated Monday, Wednesday and Friday around 4 or 5pm.  On the County’s dashboard, you can hover a mouse or click on an item for more information.  Note the tabs at top for “Summary, Demographics” and “Vaccines.”  Click here to go to today’s Solano County Dashboard.

See also my BENINDY ARCHIVE of daily Solano COVID updates (an excel spreadsheet).  I have also archived the hundreds of full CORONAVIRUS REPORTS posted here almost daily on the Benicia Independent since April 2020.

RETURN TO TOP

Solano County cuts back on COVID reporting

NOTE: The information below is not the latest.  TAP HERE for today’s latest information.

At the top of yesterday’s Solano County COVID Dashboard, Public Health announced that it will no longer post updates on Mondays, Wednesdays and Fridays.

The notice reads: Solano County Public Health Dashboards **Notice: Dashboard will be updated on Mondays and Thursdays starting the week of March 14, 2022**

This is further evidence of our Public Health Officer’s misreading of the urgency and still alarming spread of the virus here in Benicia and throughout the County. Solano leadership seems oblivious to the potential rise of the new “stealth variant” of COVID, BA.2. (See Yale Medicine, Omicron and the BA.2 Subvariant: A Guide to What We Know).

The past should provide a key warning: Solano Public Health cut back on its sharing of COVID data once before.  In the third week of June last year (2021), when the Delta variant had subsided some and we found ourselves in a lull, Public Health quit reporting 5 days a week, and went to their current M/W/F dashboard updates.

We never returned to the 5-day reporting, even as Omicron blossomed, sickened and killed.

I wrote to our too optimistic Public Health Officer, Dr. Bela Matyas, expressing my disappointment, and copied my Solano County Supervisor, Monica Brown – but I doubt my warning will have any effect.

Benicia’s 7-day COVID case count falls from HIGH to SUBSTANTIAL rate, first time since December 20

NOTE: The information below is not the latest.  TAP HERE for today’s latest information.

By Roger Straw, Friday, February 25, 2022

Solano County reports 233 new COVID infections in last two days, no deaths.  Benicia’s 7-day case count falls into SUBSTANTIAL transmission rate for first time since Dec. 20.  Solano County continues in HIGH transmission rate.

Solano Public Health COVID dashboard, Friday, February 25, 2022:

DEATHS:  Solano reported no new deaths in today’s report. Trending: Fifteen new deaths reported so far in February, ALL over 65 years of age.  The County has seen increasing COVID-related deaths each month since last November, rising to 30 in January.  A total of 396 Solano residents have now died of COVID or COVID-related causes over the course of the pandemic.

CASES BY AGE GROUP: The color-coded chart (below) shows an alarming steady increase among youth and children in Solano County.  The chart displays quarterly and recent snapshots in time by age group, each as a percentage of total cases since the outbreak began.  Increases are in red and decreases are in green as reported by Solano County.  Note the continuing increase among children & youth of Solano County.  The population of those age 0-17 in Solano County is roughly 22%.COMPARE – U.S. cases among children and youth aged 0-17 as percentage of total cases is 17.6% as of today.  (From the CDC covid-data-tracker.)

TRANSMISSION RATE: Solano is experiencing an EXTREMELY HIGH transmission rate, with a total of 1,041 new cases over the last 7 days, down from 1,123 at last report, but still way up from around 500 at Christmastime.  CDC FORMULA: Based on Solano County’s population, 450 or more cases in 7 days places Solano in the CDC’s population-based definition of a HIGH transmission rate.  We would need to drop below 225 cases in 7 days to rate as having only MODERATE community transmission.

ACTIVE CASES: Solano reported 837 ACTIVE cases today, up a bit from 822 at last report, still more than double the County’s 329 active cases on December 1.

CASES BY CITY – Friday, February 25, 2022:

  • Dixon added 7 new cases today, total of 4,133 cases.
  • Fairfield added 69 new cases today, total of 21,170 cases.
  • Rio Vista added 1 new case today, total of 1,067 cases.
  • Suisun City added 17 new cases today, total of 5,569 cases.
  • Vacaville added 50 new cases today, a total of 19,368 cases.
  • Vallejo added 85 new cases today, a total of 24,753 cases.
  • Unincorporated added 0 new cases today, a total of 191 cases.

TEST RATE:  Solano County’s 7-Day Percent Positive Test Rate shot up after Christmas and has continued through Wednesday’s very high 13%, but fell dramatically today to only 9%. Even at this lower rate, SOLANO DOES NOT COMPARE FAVORABLY: The CALIFORNIA 7-day % positive rate fell today from 3.5% to 3.2%[Source: Johns Hopkins Coronavirus Tracking CenterAND the U.S. 7-day % positive rate fell today from 5.6% to 5.3%. [Source: CDC COVID Data Tracker.] 

HOSPITALIZATIONS:

CURRENT The number of those currently hospitalized with COVID in Solano County fell today from 43 to 42 persons.

TOTAL hospitalizations over the course of the pandemic – Solano Public Health did not update its Age Group and Race/Ethnicity charts today.  Our total since the beginning of the outbreak is 3,693 Solano residents hospitalized.

ICU Bed Availability in Solano County fell slightly today from 27% to 26%, still in the Yellow danger zone.

Ventilator Availability  improved today from 58% to 67% available


HOW DOES TODAY’S REPORT COMPARE?  See recent reports and others going back to April 20, 2020 in my ARCHIVE of daily Solano COVID updates (an excel spreadsheet).


>The data on this page is from the Solano County COVID-19 Dashboard.  The Dashboard is full of much more information and updated Monday, Wednesday and Friday around 4 or 5pm.  On the County’s dashboard, you can hover a mouse or click on an item for more information.  Note the tabs at top for “Summary, Demographics” and “Vaccines.”  Click here to go to today’s Solano County Dashboard.

See also my BENINDY ARCHIVE of daily Solano COVID updates (an excel spreadsheet).  I have also archived the hundreds of full CORONAVIRUS REPORTS posted here almost daily on the Benicia Independent since April 2020.

RETURN TO TOP

Solano Public Health data on Feb. 9: A new surge? Or just playing catch-up?

NOTE: The information below is not the latest.  TAP HERE for today’s latest information.

By Roger Straw, Wednesday, February 9, 2022

Solano County reported 2,794 new infections over the last two days!  Solano County and Benicia continue to experience an extremely high transmission rate!

Solano Public Health COVID dashboard, Wednesday, February 9, 2022:

DEATHS:  Solano reported no new deaths in today’s report.  Trending: Seven new deaths reported so far in February, all over 65 years of age.  The County has seen increasing COVID-related deaths each month since last November, rising to 30 in January.  (Compare with last winter: 24 deaths in January 2021, 42 in February and 33 in March.)  A total of 388 Solano residents have now died of COVID or COVID-related causes over the course of the pandemic.

CASES BY AGE GROUP: My color-coded chart (below) shows a record over TIME.  It shows an alarming steady increase among youth and children in Solano County.  The chart displays quarterly and recent snapshots in time by age group, each as a percentage of total cases since the outbreak began.  Increases are in red and decreases are in green as reported by Solano County.  Note the continuing increase among children & youth of Solano County.  The population of those age 0-17 in Solano County is roughly 22%.COMPARE – U.S. cases among children and youth aged 0-17 as percentage of total cases is 17.4% as of today.  (From the CDC covid-data-tracker.)

COMMUNITY TRANSMISSION RATE: Solano is experiencing an EXTREMELY HIGH transmission rate, with a total of 4,010 new cases over the last 7 days, a big jump from 1,763 at last report, and way up from around 500 at Christmastime.  CDC FORMULA: Based on Solano County’s population, 450 or more cases in 7 days places Solano in the CDC’s population-based definition of a HIGH transmission rate.  We would need to drop below 225 cases in 7 days to rate as having only MODERATE community transmission.

ACTIVE CASES: Solano’s 2,517 ACTIVE cases today is up from 2,308 at last report, and well over the 2,000 active cases we had at the New Year and only 329 on December 1.

CASES BY CITY – Wednesday, February 9, 2022:

  • BENICIA added 58 new cases today, a total of 2,922 cases since the outbreak began.  TRANSMISSION RATE: Benicia has seen 100 new infections in the last 7 days, far above the CDC’s HIGH rate of community transmission. For a city with Benicia’s population, anything over 27 cases in 7 days is considered HIGH TRANSMISSION. (See chart below.)  MASKS: >> At next week’s Benicia City Council meeting, (Tues., Feb. 15), Council will consider whether and how to continue the citywide face mask mandate, in light of the State of California’s announcement that it will lift the statewide mandate on Feb. 16. >>Note that the Benicia City Council is considering adding multiple metrics rather than the single metric of the CDC’s 7-day case count to determine when it is safe to lift certain COVID restrictions (see Benicia Chooses to Continue Mask Mandate, 1/19/22)Note above that Solano County is currently also experiencing EXTREMELY HIGH transmission.

  • Dixon added 62 new cases today, total of 4,020 cases.
  • Fairfield added 1,247(!) new cases today, total of 20,349 cases.
  • Rio Vista added 27 new cases today, total of 1,040 cases.
  • Suisun City added 302(!) new cases today, total of 5,379 cases.
  • Vacaville added 443 new cases today, a total of 18,706 cases.
  • Vallejo added 653 new cases today, a total of 24,051 cases.
  • Unincorporated added 2 new cases today, a total of 188 cases.

TEST RATE:  Solano County’s 7-Day Percent Positive Test Rate shot up after Christmas and has continued through today’s very high 19%, (although today’s report shows a drop from 21% at last report.)  SOLANO DOES NOT COMPARE FAVORABLY: The California 7-day % positive rate fell to 6.7% today.  [Source: Johns Hopkins Coronavirus Tracking Center]  The U.S. 7-day % positive rate also fell today to 13.63% from 15.85% at last report. [Source: CDC COVID Data Tracker.] 

HOSPITALIZATIONS:

CURRENT hospitalizations fell today from 87 to 80 persons.  Currently hospitalized persons in Solano peaked higher than ever before on Jan 22, at 207 persons in hospital. (The County’s previous high was 176 on Jan 7, 2021.)

TOTAL hospitalizations – Solano Public Health updated its age and race hospitalizations charts today, adding 1 Asian person, age 65+.  Our total since the beginning of the outbreak is now 3,512 hospitalizations.

ICU Bed Availability in Solano County remained steady today at 24% available, still in the Yellow danger zone.

Ventilator Availability  fell dramatically today from 64% to 51% available


HOW DOES TODAY’S REPORT COMPARE?  See recent reports and others going back to April 20, 2020 in my ARCHIVE of daily Solano COVID updates (an excel spreadsheet).


>The data on this page is from the Solano County COVID-19 Dashboard.  The Dashboard is full of much more information and updated Monday, Wednesday and Friday around 4 or 5pm.  On the County’s dashboard, you can hover a mouse or click on an item for more information.  Note the tabs at top for “Summary, Demographics” and “Vaccines.”  Click here to go to today’s Solano County Dashboard.

See also my BENINDY ARCHIVE of daily Solano COVID updates (an excel spreadsheet).  I have also archived the hundreds of full CORONAVIRUS REPORTS posted here almost daily on the Benicia Independent since April 2020.

RETURN TO TOP