
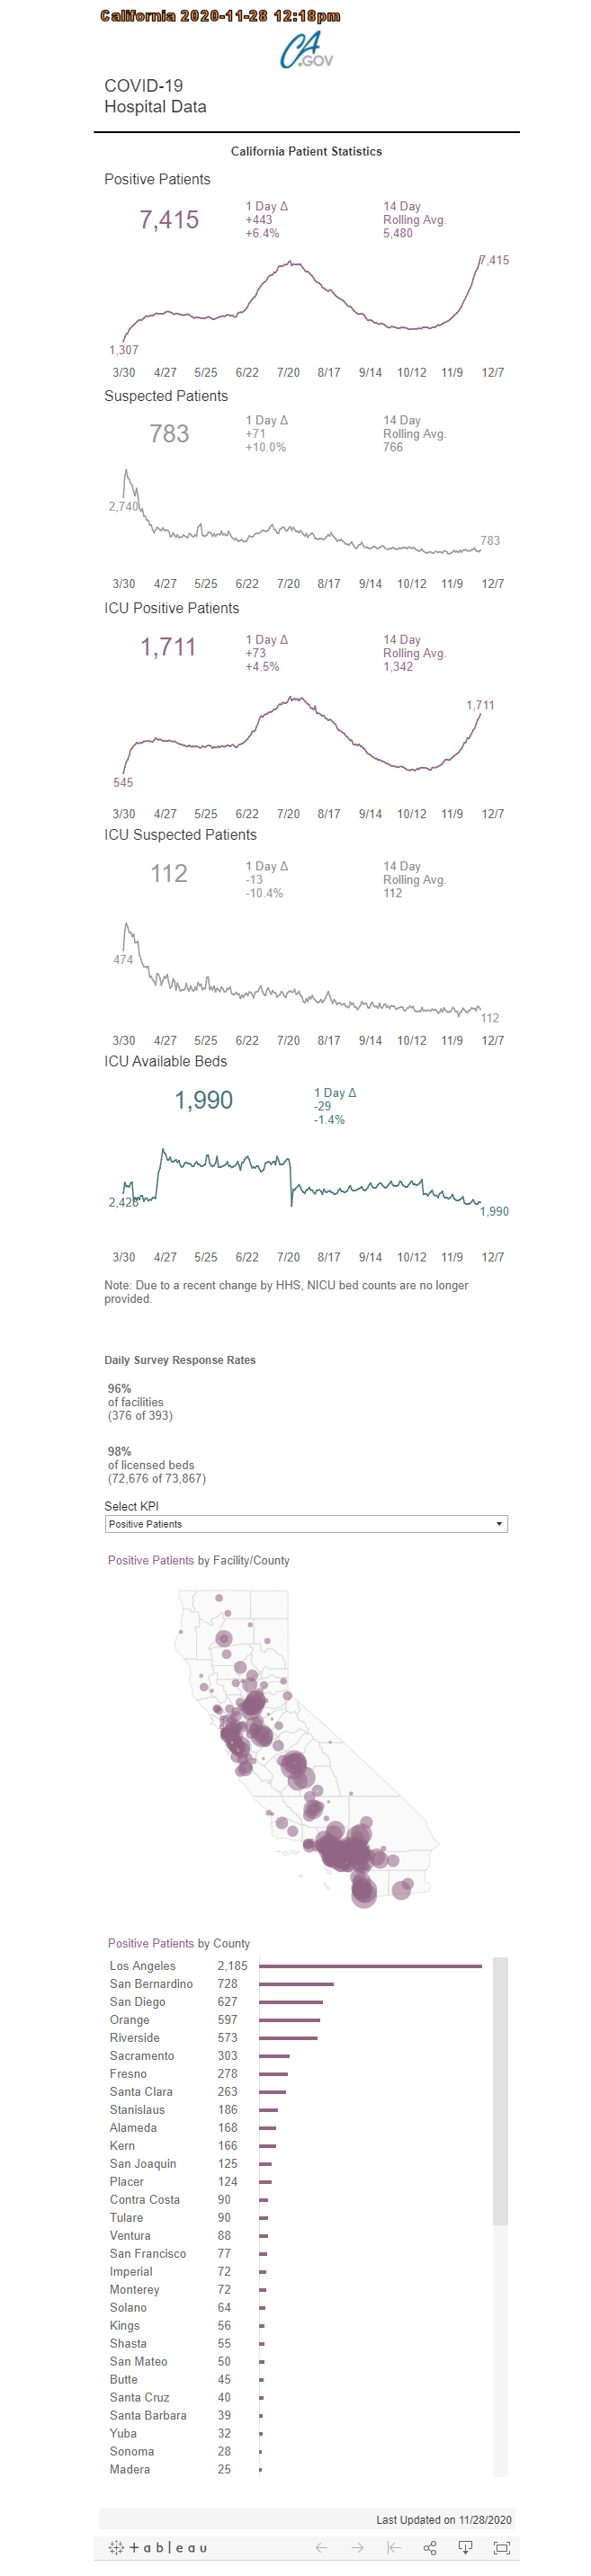
More detail from COVID19.CA.GOV

In some respects, COVID19.CA.GOV does a better job of reporting Solano County data than our own Solano County Public Health Department. The State of California posts data over the weekends, details it in more current charts, and shows changes from the prior day and displays 14-day running averages.
Data that can only be seen on the County’s COVID-19 Dashboard are Cumulative Cases By City, Number of Residents Tested, Test Rates, and Total Hospitalizations Since the Outbreak Began (calculated here on the BenIndy using the County’s Age Group data). For that, stay tuned….
>>All of the other information you have seen posted here daily since last April can now be found on these two pages:
[I will follow later with an updated version of my usual Solano County Coronavirus Dashboard. Stay tuned….]
Monday, November 30: 612 new cases over the 5-day Thanksgiving weekend, no deaths. Since the outbreak began: 10,648 cases, 603 hospitalized, 81 deaths. Compare previous report, Wednesday, Nov. 25:
 Summary


- Solano County reported 612 new cases over the 5-day Thanksgiving weekend. Total of 10,648 cases since the outbreak started.
- Deaths – no new deaths reported today, a total of 81 Solano deaths since the pandemic began.
- Active cases – Solano reported 53 fewer active cases today, total of 860 active cases. Active cases have increased alarmingly lately – COMPARE: average number of Active Cases during October was 284 – today we are at 860! Is the County equipped to contact trace so many infected persons? Who knows? To my knowledge, Solano has offered no reports on contact tracing.
- Hospitalizations – (See BenIndy page, COVID-19 Hospitalizations Daily Update for Solano County.) TOTAL hospitalized since the outbreak began increased by 6 today, total of 603. [For manual calculation of total, see age group stats below.]
- ICU Beds – (See BenIndy page, COVID-19 Hospitalizations Daily Update for Solano County.) The County reported no change in ICU beds available today, remaining at 33%.
- Testing – The County reports today that 3,067 residents were tested over the long holiday weekend, a total of 127,144 unduplicated residents tested for COVID-19 since the outbreak began.
Positive Test Rate – still extremely high, 12.3%
 Solano County reported our 7-day average positive test rate remained steady over the long holiday weekend at 12.3% – still far and away over the State’s purple tier threshold of 8%. Average percent positive test rates are among the best metrics for measuring community spread of the virus. The much lower and more stable California 7-day average test rate has also been on the rise lately, but remained at 6.5% over the long weekend. (Note that Solano County displays past weeks and months in a 7-day test positivity line graph which also shows daily results. However, the chart does not display an accurate number of cases for the most recent days, as there is a lag time in receiving test results. The 7-day curve therefore also lags behind due to unknown recent test results.)
More…
The County’s Coronavirus Dashboard is USUALLY full of much more information, too extensive to cover here on a daily basis. The Benicia Independent will continue to summarize daily and highlight significant portions. For more, check out the Dashboard at https://doitgis.maps.arcgis.com/apps/MapSeries/index.html?appid=055f81e9fe154da5860257e3f2489d67.


You must be logged in to post a comment.