
Solano County reports 71 new COVID infections today, percent positive test rate steadily increasing, now up to 7.2%.
See: All about the DELTA VARIANT. Also, People with mild COVID can have long-term health problems. And: “More than 70% of COVID-19 patients studied report having at least one “long haul” symptom that lasts for months.” It’s not over yet!
Solano County COVID report on Friday, July 2.
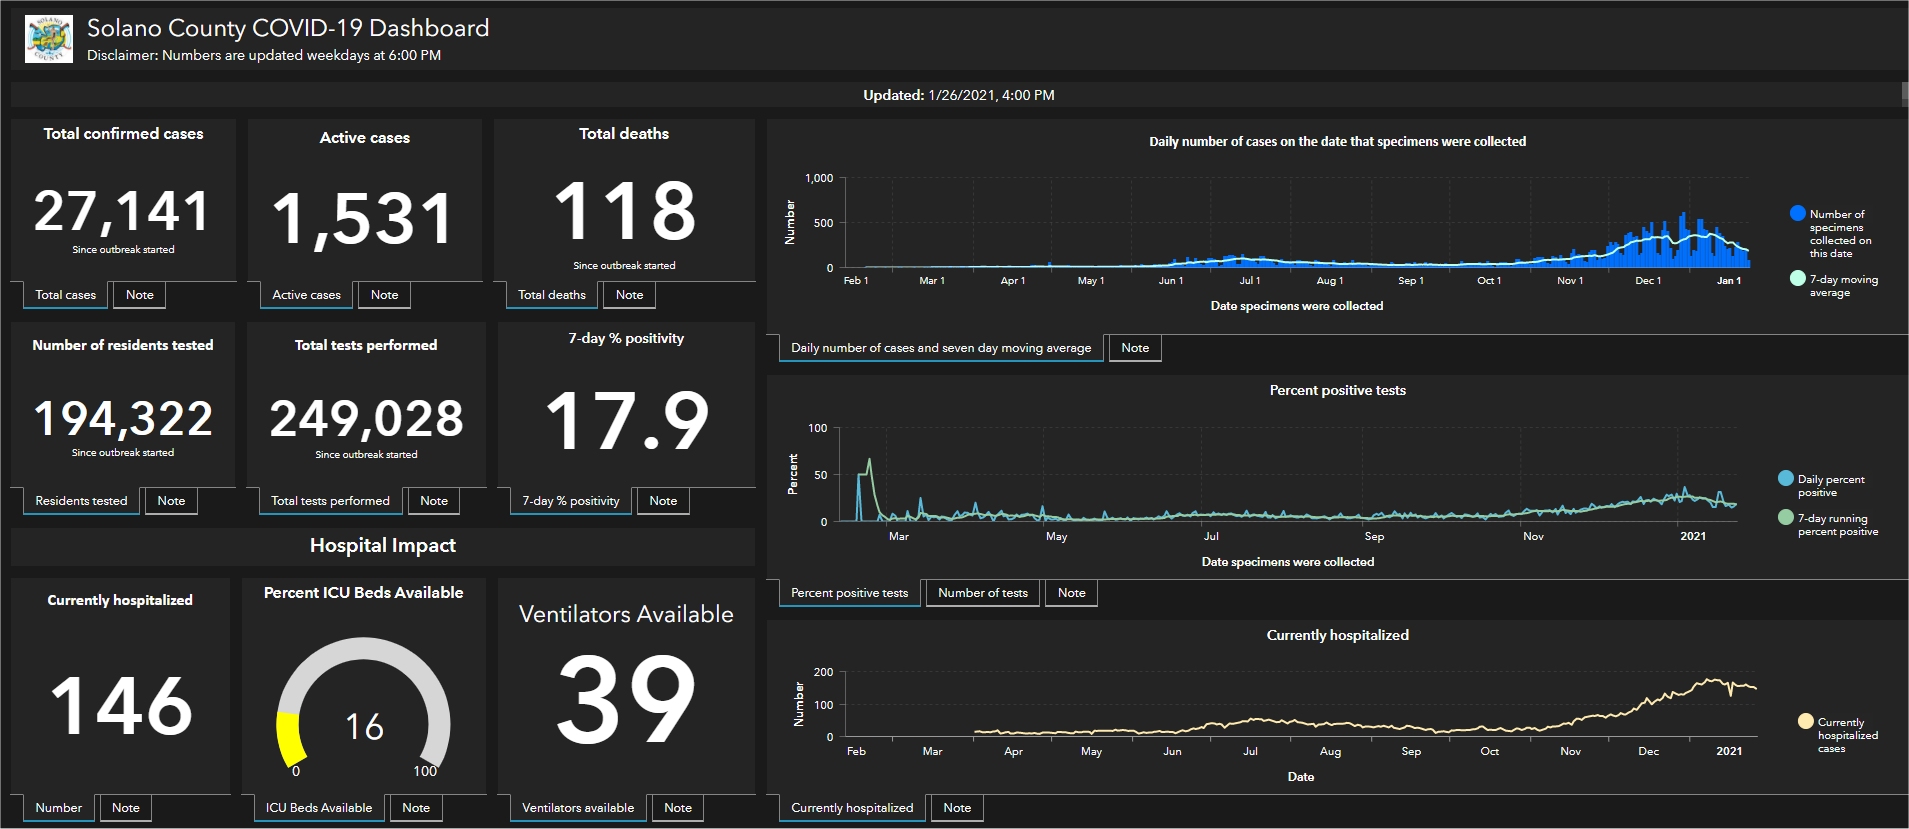
[Source: see far below. See also my ARCHIVE spreadsheet of daily Solano COVID updates.]Solano County COVID-19 Dashboard – SUMMARY:

Solano County reported 71 new COVID cases since Wednesday’s report, an average of 35 per day. Monthly: Solano County saw 1,288 new cases in April, an average of 43 per day. In May, Solano reported 920 new cases, an average of 30 per day. In June, we saw 751 new cases in Solano, an average of 23 new infections each day. Solano’s 218 active cases today is up from Wednesday’s 183 and Monday’s 144. Our percent positivity rate rose significantly again today from 6.6% to 7.2%. COVID is still out there – TAKE CARE!
Hospitalizations – a rare Solano County update
Solano County reported 18 previously undisclosed hospitalizations yesterday. The County updates these important numbers only occasionally, and only then they must be independently discovered in the County’s demographic chart labeled “Hospitalizations by Age Group.” That chart hasn’t been updated since May 25, when a total of 1,286 persons had been hospitalized. Yesterday, the County added hospitalizations in the following age groups: 1 youth aged 0-17, 3 persons aged 18-49, 6 persons aged 50-64, and 8 of our elders aged 65+. No further updates today, unchanged totals:
| Age Group | Hospitalizations | % of Total |
| 0-17 | 27 | 2% |
| 18-49 | 326 | 25% |
| 50-64 | 340 | 26% |
| 65+ | 611 | 47% |
| TOTAL | 1,304 | 100% |
Hospitalizations are also recorded on the County’s demographic chart labeled “Hospitalizations by Race / Ethnicity.” Here are the current numbers. Interestingly, the total doesn’t square with totals by age groups. (My hunch is that the County has not updated this chart for a time.)
| Race / Ethnicity | Hospitalizations | % of Total |
| Asians | 184 | 15% |
| Black / African American | 197 | 16% |
| Hispanic / Latinx | 327 | 27% |
| White | 405 | 34% |
| Multirace / Others | 85 | 7% |
| TOTAL | 1,198 | 99% |
The one bit of good news is that Solano County reported no new deaths again today, and has not added a death since June 4. The County total is 244 deaths since the pandemic began.
Cases by City on Friday, July 02:

- Benicia added 1 new case today, a total of 1,030 cases since the outbreak began, 3.7% of its population of 27,570.
- Dixon added 3 new cases today, total of 1,950 cases, 9.9% of its population of 19,794.
- Fairfield added 18 new cases today, total of 9,225 cases, 7.9% of its population of 117,149.
- Rio Vista added 1 new case today, total of 397 cases, 4.2% of its population of 9,416.
- Suisun City added 5 new cases today, total of 2,339 cases, 7.9% of its population of 29,447.
- Vacaville added 22 new cases today, a total of 8,963 cases, 9.1% its of population of 98,807.
- Vallejo added 21 new cases today, a total of 10,037 cases, 8.4% of its population of 119,544.
- Unincorporated areas remained steady for the 57th day in a row today (no increase since May 8!), total of 103 cases (population figures not available).
RE-OPENING GUIDELINES IN SOLANO COUNTY

See latest info on California’s COVID web page. See also the Solano County Public Health Coronavirus Resources and Updates page. (Click on the image at right to go directly to the page, or click on various links below to access the 10 sections on the County’s page.)
COMPARE: From the most recent report on Solano County COVID Dashboard, Wednesday, June 30:


The data on this page is from today’s and the previous Solano County COVID-19 Dashboard. The Dashboard is full of much more information and updated weekdays around 4 or 5pm. On the County’s dashboard, you can hover a mouse or click on an item for more information. Note the tabs at top for Summary, Demographics and Vaccines. Click here to go to today’s Solano County Dashboard.[sta_anchor id=”sources” /]
Sources
- Solano County Coronavirus Dashboard (posted on the County website today).
- The State of California’s Open Data Profile at COVID19.CA.GOV
- See also on the BenIndy: Hospitalizations AND ICU Beds by REGION.
- See also my ARCHIVE of daily Solano COVID updates (an excel spreadsheet).
You must be logged in to post a comment.