Tag Archives: Hospitalizations

Solano County hospitalizations on 2020-12-01: 69 positive patients, 21 in ICU, more suspected

By Roger Straw, December 2, 2020

12 ICU beds remain available

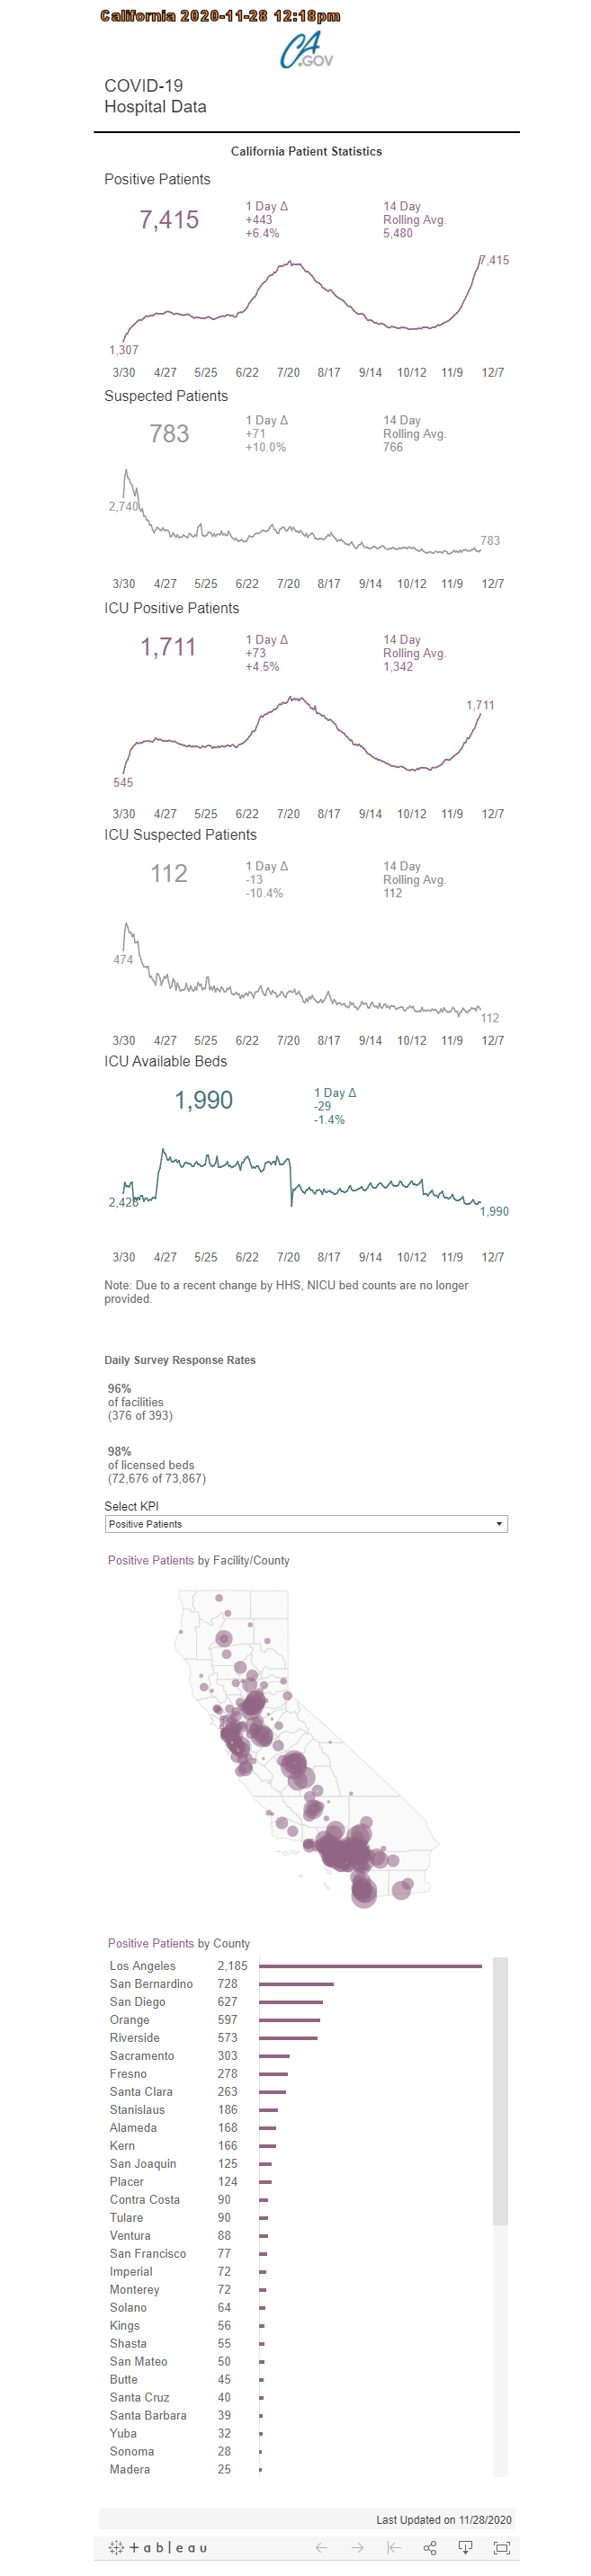
The State of California’s  COVID19.CA.GOV website is an incredibly rich resource for daily updates with latest data on hospitalizations (and much more) – both for the State and by individual Counties.

Each day the State updates the numbers along with “Change from Prior Day” and “14-Day Rolling Average.”  Below is a summary, followed by a screenshot of today’s results.  The CURRENT data on the CA.GOV Hospitalizations page provides much more by simply hovering over various components.

Today CA.GOV showed Solano County COVID19 hospitalizations as of yesterday, Tuesday November 1:

  • 69 Positive Patients (3 more than previous day, 14 day rolling average of 61)
  • 12 additional Suspected Patients (1 fewer than previous day, 14 day rolling average of 11)
  • 21 ICU Positive Patients (3 more than previous day, 14 day rolling average of 15)
  • 3 additional ICU Suspected Patients (same as previous day, 14 day rolling average of 2)
  • 12 ICU Available Beds (same as previous day)
As of yesterday, Tuesday, December 1, 2020
Previous day’s report – data as of Monday, November 30, 2020

Solano County hospitalizations on 2020-11-30: 7 more positive patients, 3 more in ICU

By Roger Straw, December 1, 2020

Slight improvement over previous day

The State of California’s  COVID19.ca.gov website is an incredibly rich resource for daily updates with latest data on hospitalizations (and much more) – both for the State and by individual Counties.

Each day the State updates the numbers along with “Change from Prior Day” and “14-Day Rolling Average.”  Below is a screenshot of today’s results.  The CURRENT data on the COVID19 website provides much more by simply hovering over various components.

On Tuesday, December 1, COVID19.CA.GOV showed Solano County COVID19 hospitalizations as of Monday, November 30:

  • 66 Positive Patients (7 more than previous day, 14 day rolling average of 60)
  • 13 additional Suspected Patients (1 fewer than previous day, 14 day rolling average of 11)
  • 18 ICU Positive Patients (3 more than previous day, 14 day rolling average of 14)
  • 3 additional ICU Suspected Patients (same as previous day, 14 day rolling average of 2)
  • 12 ICU Available Beds (3 fewer than previous day)
As of yesterday, Monday, November 30, 2020
Yesterday’s report – As of Sunday, November29,2020

Solano County hospitalizations, 2020-11-30

By Roger Straw, November 30, 2020

Slight improvement over previous day

The State of California’s  COVID19.ca.gov website is an incredibly rich resource for daily updates with latest data on hospitalizations (and much more) – both for the State and by individual Counties.

Each day the State updates the numbers along with “Change from Prior Day” and “14-Day Rolling Average.”  Below is a screenshot of today’s results.  The CURRENT data on the COVID19 website provides much more by simply hovering over various components.

On Sunday, November 29, Solano County showed COVID19 hospitalizations as follows:

  • 59 Positive Patients (5 fewer than previous day, 14 day rolling average of 58)
  • 14 additional Suspected Patients (3 more than previous day, 14 day rolling average of 11)
  • 15 ICU Positive Patients (2 fewer than previous day, 14 day rolling average of 14)
  • 3 additional ICU Suspected Patients (same as previous day, 14 day rolling average of 2)
  • 15 ICU Available Beds (2 more than previous day)
  • See map below for data on numbers of patients in hospital facilities by City

COVID19.CA.GOV on Solano County hospitalizations, 2020-11-28

By Roger Straw, November 29, 2020

The State of California’s COVID19.ca.gov website is an incredibly rich resource for daily updates with latest data on hospitalizations (and much more) – both for the State and by individual Counties.

Each day the State updates the numbers along with “Change from Prior Day” and “14-Day Rolling Average.”  The only thing lacking is a good archive so one can easily look back over time.  An excel file is beyond my time limits at this time, but I will take a screenshot of each day’s results and post it here.  The CURRENT data on the COVID19 website provides much more by simply hovering over various components.

Below is the screenshot showing Solano County data for Saturday, November 28.  Click on the image for full screen viewing.  (Screenshot for California is also viewable here.)