By Roger Straw, November 25, 2020
The Solano County summary dashboard has failed to display numbers so far this week for Currently Hospitalized patients. (However, see below for details found on the Solano dashboard’s graph chart.)
This morning, the San Francisco Chronicle reported that we have 61 patients in the hospital as of yesterday, Tues Nov 24. This represents an increase of 10 patients since the County’s last report on Fri Nov 20. See details below.
Even better, the State of California covid19.ca.gov reported that Solano had 63 patients in the hospital as of Tues Nov 24, which would indicate an increase of 12 patients since Solano last reported. This report also contains important information on suspected cases and ICU beds. See details below.
Santa Clara, Solano counties worry COVID-19 patients soon will overwhelm hospitals
SFChronicle, November 25, 2020
COVID hospitalizations spiking in some counties: Two Bay Area counties have more patients hospitalized with COVID-19 now than at any other time in the pandemic, raising concerns that they will be overwhelmed if cases climb as expected after Thanksgiving. Solano County had 61 COVID-19 patients in hospitals as of Tuesday — four more than the peak in the summer surge. Santa Clara County had 201 patients, five more than the summer high. In the Bay Area, 614 people were hospitalized, well below the summer peak of 815, but a 39% increase over just the past week.
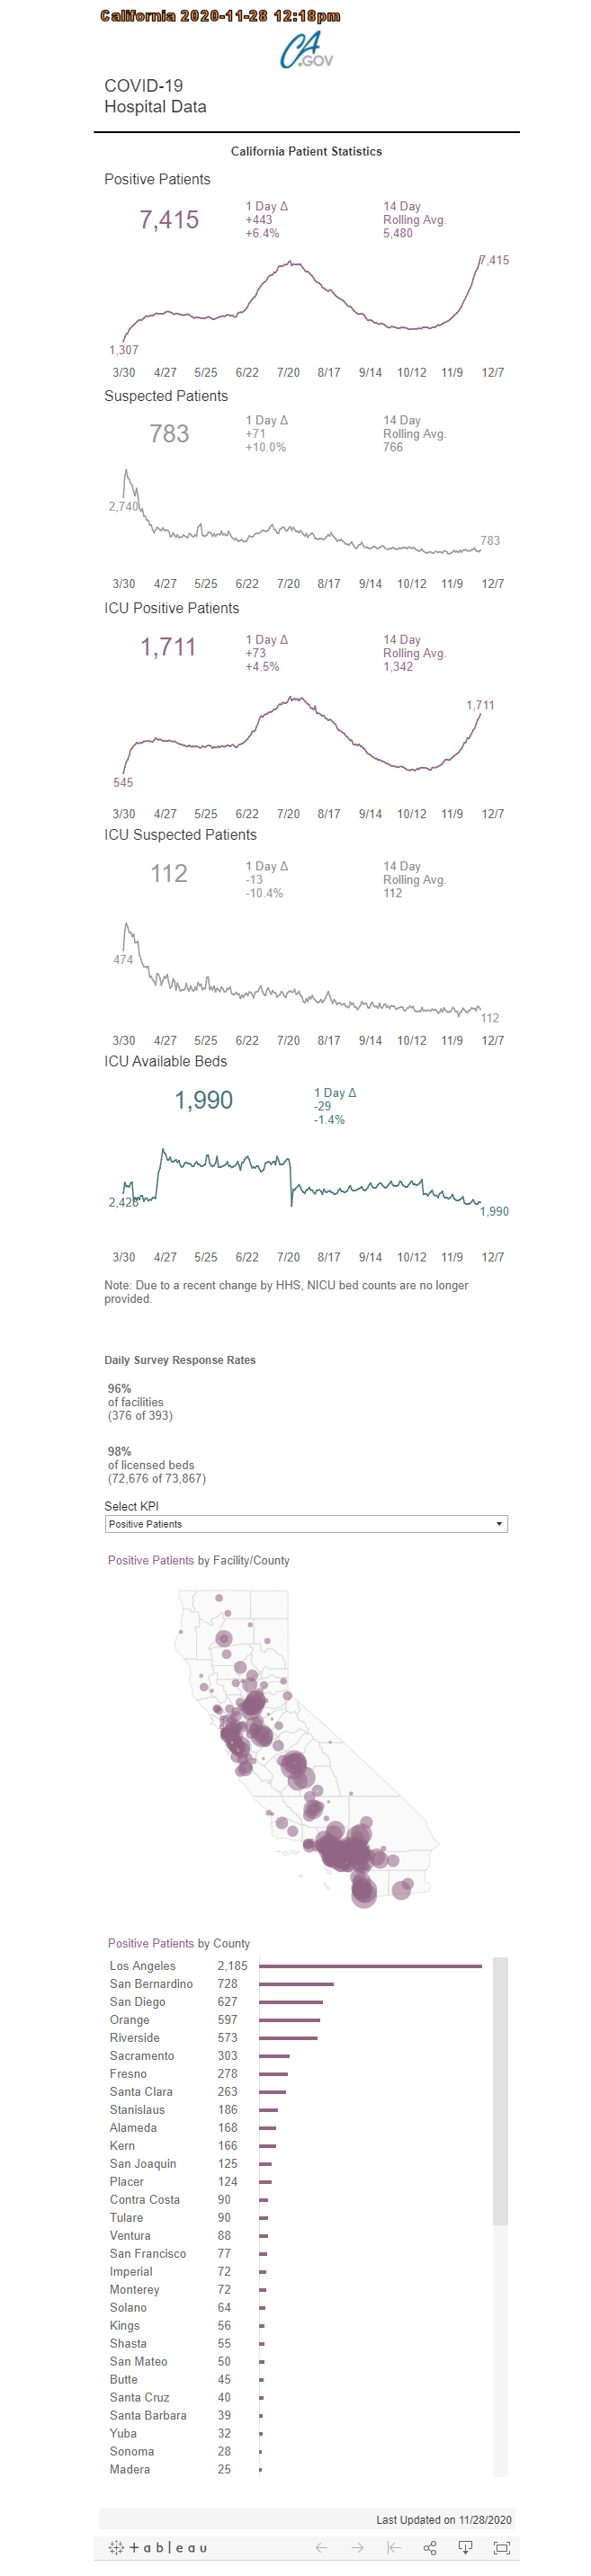
covid19.ca.gov shows Solano with 63 currently hospitalized patients as of Wed Nov 24
 …additional details:
-
- 63 currently hospitalized COVID patients
- 11 more suspected cases who are currently hospitalized, for a possible total of 74 currently hospitalized COVID patients
- 15 COVID patients in ICU beds (and 2 additional suspected COVID patients in ICU beds), possible total of 17
- 12 ICU beds remaining available
Solano County dashboard on hospitalizations: no summary number, but delayed reporting is visible on graph chart
 For months, I have relied on a simple numerical representation of current hospitalizations on Solano County’s daily COVID update. For the first time this week, that box has shown “No Value.” The dashboard also has a graphic chart of current hospitalizations, but it shows delayed results, so I have quit relying on it. In fact I hadn’t even looked at it for a long time. When I remembered, I checked yesterday’s graph, and sure enough, it does show some new information. Here’s the graph from yesterday, presented on the Solano County COVID dashboard at around 4pm.
 On the dashboard only, not on this screenshot, if you hover over each day’s point on the graph, you will get a small popup showing the
  County’s number of currently hospitalized patients on that date. Hospitalizations have been on a very steep climb lately. The most recent date shows Sat Nov 21 with 59 COVID patients hospitalized, an increase of 8 over the 51 reported on Fri Nov 20.

 The State of California’s COVID19.ca.gov website is an incredibly rich resource for daily updates with latest data on hospitalizations (and much more) – both for the State and by individual Counties.


You must be logged in to post a comment.