
COVID is still spreading and deadly in Solano County – stay safe this weekend!
EXTRA: Check out NY Times, “Super Bowl Party or Superspreader Event? Experts offer tips on how to stay safe.“
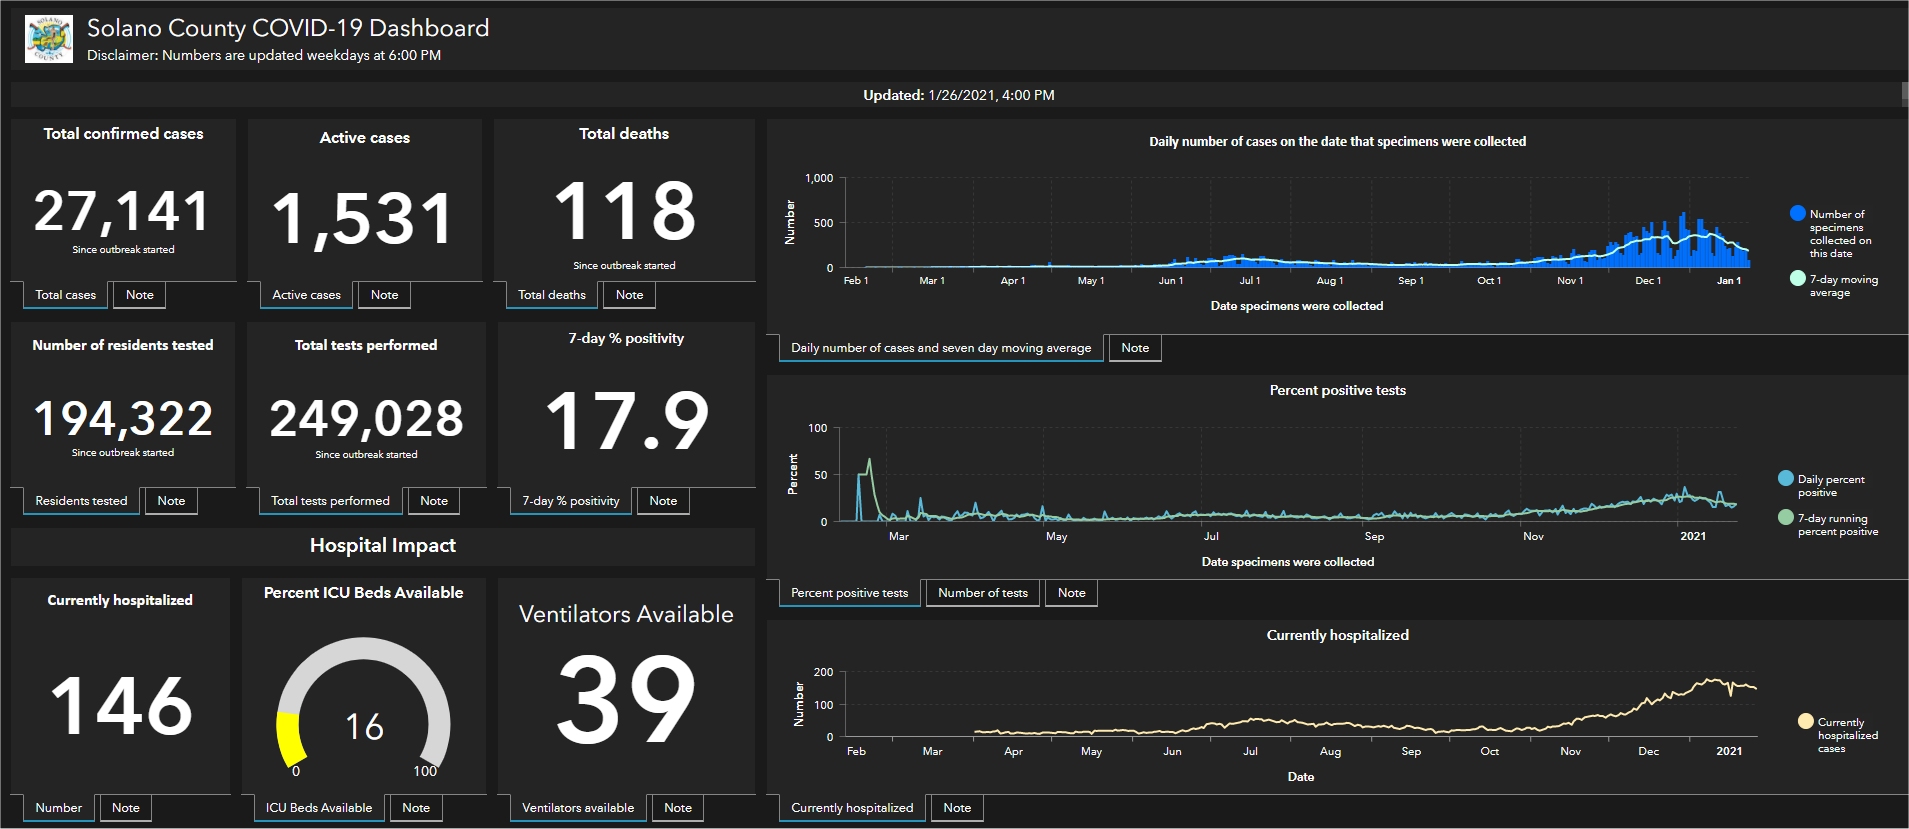
Friday, February 5: 175 new Solano cases overnight, no new deaths. Since February 2020: 28,686 cases, over 840 hospitalized, 134 deaths. Compare previous report, Thursday, February 4:
 Summary


-
- CASES – Solano County reported 175 new cases overnight, total of 28,686 cases since the outbreak started. In the month of January, Solano added 8,495 new cases, for an AVERAGE of 274 new cases per day.
- [sta_anchor id=”deaths” /]DEATHS – the County reported no new deaths today, a total of 134 Solano deaths since the pandemic began. 12 new COVID deaths were reported in the first 4 days of February! In the month of January, Solano recorded 24 coronavirus deaths. While many other COVID stats are improving, the recent surge in deaths is no doubt the final sad result of our holiday surge.
- ACTIVE cases – Solano reported 70 fewer active cases today, a total of 1,101 active cases. Compare: Solano’s average number of Active Cases during October was 284, average in November was 650, in December 1,658 – and TODAY we are at 1,101. Is the County equipped to contact trace so many infected persons? My guess is we just sit back and wait for a voluntary 10 day quarantine to expire. Who knows? To my knowledge, Solano has offered no reports on contact tracing.
- HOSPITALIZATIONS – (See expanding ICU capacity and ventilator availability below.) Today, Solano reported 7 fewer currently hospitalized cases, total of 97. However, in the number of hospitalizations among age groups, the county reported an increase of 2 new hospitalizations, including 1 person under age 18 and another over 65, for a total of 844 hospitalized in all age groups since the pandemic began.) Even then, accuracy cannot be certain – note>> In a Dec. 31 Fairfield Daily Republic article, reporter Todd Hanson wrote, “Since the start of the pandemic, and as of Wednesday, 9,486 residents have been hospitalized.” This startling number is far and away above the number of residents hospitalized as indicated in the County’s count of age group hospitalizations, and not available anywhere on the County’s COVID-19 dashboard. Asked about his source, Hanson replied that Solano Public Health “had to do a little research on my behalf.” It would be good if the County could add Total Hospitalized to its daily Dashboard update. [For the numbers used in my manual calculation of total hospitalizations, see age group stats below. For COVID19-CA.GOV numbers, see BenIndy page, COVID-19 Hospitalizations Daily Update for Solano County.][sta_anchor id=”icu” unsan=”ICU” /]
 ICU BEDS – Solano hospitals recently expanded their ICU capacity [see Benicia Independent, “Why the sudden improvement in our ICU bed numbers?“] Even with the expanded ICU capacity, Solano County has dropped back and remains in the YELLOW DANGER ZONE in ICU beds available, 28% today, down from 29% yesterday. The State’s COVID19-CA.GOV reported today that Solano County had ONLY 12 AVAILABLE ICU BEDS as of yesterday, February 4. (For COVID19-CA.GOV info see BenIndy page, COVID-19 Hospitalizations Daily Update for Solano County, and for REGIONAL data see COVID-19 ICU Bed Availability by REGION.)
 VENTILATORS available – Last week, for the first time since July 24 of last year, Solano County is reporting the percentage of ventilators available. Today Solano hospitals have 62% of ventilators available, up from yesterday’s 47% but down substantially from last summer’s reports of 82-94% available.


Positive Test Rate – SOLANO TEST RATE REMAINS ALARMINGLY HIGH, 12.2% – VIRUS STILL SPREADING, STAY HOME!
 Solano County reported our 7-day average positive test rate of 12.2%, down from yesterday’s 12.7%, but well above the State’s purple tier threshold of 8%. Average percent positive test rates are among the best metrics for measuring community spread of the virus. COMPARE: The much lower and more stable California 7-day average test rate was 5.8% today, down from yesterday’s 6.1%. (Note that Solano County displays past weeks and months in a 7-day test positivity line graph which also shows daily results. However, the chart does not display an accurate number of cases for the most recent days, as there is a lag time in receiving test results. The 7-day curve therefore also lags behind due to unknown recent test results.)
By Age Group

- Youth 17 and under – 18 new cases overnight, total of 3,309 cases, representing 11.5% of the 28,686 total cases. 1 new hospitalization was reported today among this very young age group, total of 18 since the outbreak began. Thankfully, no deaths have ever been reported in Solano County in this age group. But cases among Solano youth rose steadily over the summer, from 5.6% of total cases on June 8 to 11% on August 31 and has plateaued at over 11% since September 30. Youth are 22% of Solano’s general population, so this 11% may seem low. The significance is this: youth are SERIOUSLY NOT IMMUNE (!) – in fact at least 18 of our youth have been hospitalized since the outbreak began.
- Persons 18-49 years of age – 97 new cases overnight, total of 15,851 cases. This age group is 41% of the population in Solano, but represents 55.3% of the total cases, by far the highest percentage of all age groups. The County reported no new hospitalizations among persons in this age group today. A total of 243 are reported to have been hospitalized since the outbreak began. Solano recorded no new deaths in this young group today, total of 9 deaths. Some in this group are surely at high risk, as many are providing essential services among us, and some may be ignoring public health orders. I expect this group is a major factor in the spread of the virus.
- Persons 50-64 years of age – 42 new cases overnight, total of 6,011 cases. This age group represents 21% of the 28,686 total cases. The County reported no new hospitalizations among persons in this age group today. A total of 230 are reported to have been hospitalized since the outbreak began. No new deaths were reported in this age group today, a total of 21 deaths.
- Persons 65 years or older – 18 new cases overnight, total of 3,504, representing 12.2% of Solano’s 28,686 total cases. The County reported 1 new hospitalization among persons in this age group today, a total of 353 hospitalized since the outbreak began. No new deaths were reported in this age group today. A total of 104 of our elders have died of COVID, accounting for 78% of Solano’s 134 total deaths.[sta_anchor id=”citydata” /]
City Data

- Benicia added 5 new cases overnight, total of 819 cases since the outbreak began.
- Dixon added 9 new case overnight, total of 1,693 cases.
- Fairfield added 45 new cases overnight, total of 7,844 cases.
- Rio Vista added 5 new case overnight, total of 278 cases.
- Suisun City added 7 new case overnight, total of 1,925 cases.
- Vacaville added 41 new cases overnight, total of 7,586 cases.
- Vallejo added 63 new cases overnight, total of 8,455 cases.
- Unincorporated areas remained steady today, total of 86 cases.
Race / Ethnicity
 The County report on race / ethnicity includes case numbers, hospitalizations, deaths and Solano population statistics. This information is discouragingly similar to national reports that indicate significantly worse outcomes among black and brown Americans. Note that all of this data surely undercounts Latinx Americans, as there is a large group of “Multirace / Others” which likely is composed mostly of Latinx members of our communities.
- Asian Americans are 14% of Solano’s population, and account for 12% of cases, 12% of hospitalizations, and 17% of deaths.
- Black Americans are 14% of Solano’s population, and account for 11% of cases, but 17% of hospitalizations, and 22% of deaths.
- Latinx Americans are 26% of Solano’s population, but account for 13% of cases, 21% of hospitalizations, and 13% of deaths.
- Multi-race / Others are 7% of Solano’s population, but account for 35% of cases, 18% of hospitalizations, and 12% of deaths.
- White Americans are 39% of the population in Solano County, but only account for 29% of cases, 31% of hospitalizations and 33% of deaths.
More…
The County’s Coronavirus Dashboard is full of much more information, too extensive to cover here on a daily basis. The Benicia Independent will continue to summarize daily and highlight significant portions. For more, check out the Dashboard at https://doitgis.maps.arcgis.com/apps/MapSeries/index.html?appid=055f81e9fe154da5860257e3f2489d67.[sta_anchor id=”below” /]


You must be logged in to post a comment.