Category Archives: Solano County CA

BREAKING: CDC recommends indoor masking for all in Bay Area

CDC recommends entire Bay Area issue indoor mask mandate

SFGate, by Eric Ting, July 27, 2021
The CDC’s map of California counties by COVID-19 transmission rates. Masks are recommended in red and orange counties. (Center for Disease Control and Prevention) – Click here (or on the image) to go to interactive CDC map.

The Centers for Disease Control and Prevention (CDC) revised its masking guidance Tuesday to advise that all individuals — including vaccinated ones — wear masks indoors in areas with “high” and “substantial” COVID-19 transmission.

According to the CDC’s map, four Bay Area counties — San Francisco, Alameda, Contra Costa and Solano — are classified as areas of “high” transmission and the other five — Santa Clara, San Mateo, Marin, Sonoma, Napa — are classified as areas of “substantial” transmission. Masking is currently recommended but not required in every Bay Area county except Solano.

Given how Bay Area counties have previously handled the pandemic, it seems highly likely the region will turn their recommendations into mandates following the updated CDC guidance. A mask mandate is currently in effect in Los Angeles County.

Across California, most counties fall into the “high” or “substantial” categories.

California Gov. Gavin Newsom said Tuesday the state would issue updated statewide guidance sometime after the CDC guidance was released.

The CDC said the change in guidance is based on new evidence showing that while fully vaccinated individuals are protected against severe disease from the delta variant, they can transmit it to unvaccinated individuals more easily than other strains of the virus.

CDC Director Dr. Rochelle Walensky said that when earlier strains of the virus were dominant, infected vaccinated people were found to have low levels of virus in their nose and throats and were deemed unlikely to spread the virus. That has changed with the delta variant, where Walensky said the level of virus in infected vaccinated people is “indistinguishable” from the level of virus in infected unvaccinated people.

The Associated Press contributed to this report.

Summer surge hitting Solano County hospitals, test positivity far surpassing US and CA rates


By Roger Straw, Monday, July 26, 2021

Solano County on Monday, July 26: 289 new COVID infections over the weekend.  Hospitalizations up dramatically.  Test positivity nears 17%!

Solano County COVID dashboard SUMMARY:
[Sources: see below.  See also my ARCHIVE spreadsheet of daily Solano COVID updates.]

Solano County reported no new deaths today.  The County total is now 245 deaths since the pandemic began.  But the County reported  289 new COVID cases over the weekend, 96 per day!  Solano is clearly experiencing a “summer surge” in cases.

TREND: Cases-per-day dramatically up in July

Cases-per-day were trending downward in recent months, but are now rising sharply, especially over the last week:

Solano’s 451 ACTIVE cases is down from Friday’s remarkable high of 647, but still higher than anything since February 19, 2021.  Active cases have risen alarmingly in just two weeks, up from 289 cases on July 12.

Test Rate INCREDIBLY HIGH – compare with US & CA

Our 7-day average percent positivity rate was up alarmingly again today from a shocking 14.9% on Friday to an even more surprising 16.8% today, the County’s highest rate since January 29, 2021.  We would be decidedly back in the PURPLE TIER with rates this high.  COMPARE: The US 7-day % positive rate today is at 5.3%, and the California rate is 3.8%. [Source: Johns Hopkins]

Hospitalizations – fewer ICU Beds and Ventilators available

CURRENT hospitalizations jumped today from 33 to 45 persons CURRENTLY hospitalized with COVID.   ICU beds available fell dramatically today from 50% to only 32%. And the County reported fewer ventilators available today, down from 80 to 69.  These numbers confirm the spike in hospitalizations, see below…

The County updates the intake/discharge total of CURRENTLY hospitalized cases with every report, but never reports on the cumulative total of hospitalized COVID patients over the course of the pandemic.  That total must be independently discovered in the County’s occasional update of the Hospitalizations by Age Group chart which was not updated today, and now shows a total of 1,309 persons hospitalized since the beginning of the outbreak, in the following age groups:

Age Group Hospitalizations % of Total
0-17 27 2%
18-49 327 25%
50-64 342 26%
65+ 613 47%
TOTAL 1,309 100%

Hospitalizations are also recorded on the County’s demographic chart labeled “Hospitalizations by Race / Ethnicity.”  The chart was not updated today.  Here are the current numbers.  Interestingly, the total doesn’t square with totals by age groups.

Race / Ethnicity Hospitalizations % of Total
Asians 184 15%
Black / African American 200 16%
Hispanic / Latinx 327 27%
White 406 34%
Multirace / Others 86 7%
TOTAL 1,203 99%
SUMMER SURGE – Masks, Social Distancing & Vaccination

COVID is clearly circulating again and surging in Solano County!  Some California counties are returning to mandatory masks for all in crowded places, and today the State of California issued a policy for state employees and health care workers, requiring them to either get vaccinated or be tested weekly for the virus.  In the Bay Area, Solano County is the only holdout against even RECOMMENDING masks in public indoors spaces.  My personal plan is to mask indoors in public even though I’m vaccinated, and I’d recommend it for you, too.  This thing ain’t over yet!

Cases by City on Monday, July 26:
  • Benicia added 8 new cases today, a total of 1,092 cases since the outbreak began, 4.0% of its population of 27,570.
  • Dixon added 7 new case today, total of 1,997 cases, 10.1% of its population of 19,794.
  • Fairfield added 74 new cases today, total of 9,560 cases, 8.2% of its population of 117,149.
  • Rio Vista added 4 new cases today, total of 421 cases, 4.5% of its population of 9,416.
  • Suisun City added 38 new cases today, total of 2,487 cases, 8.4% of its population of 29,447.
  • Vacaville added 82 new cases today, a total of 9,341 cases, 9.5% its of population of 98,807.
  • Vallejo added 76 new cases today, a total of 10,476 cases, 8.8% of its population of 119,544.
  • Unincorporated remained steady today, a total of 108 cases (population figures not available).

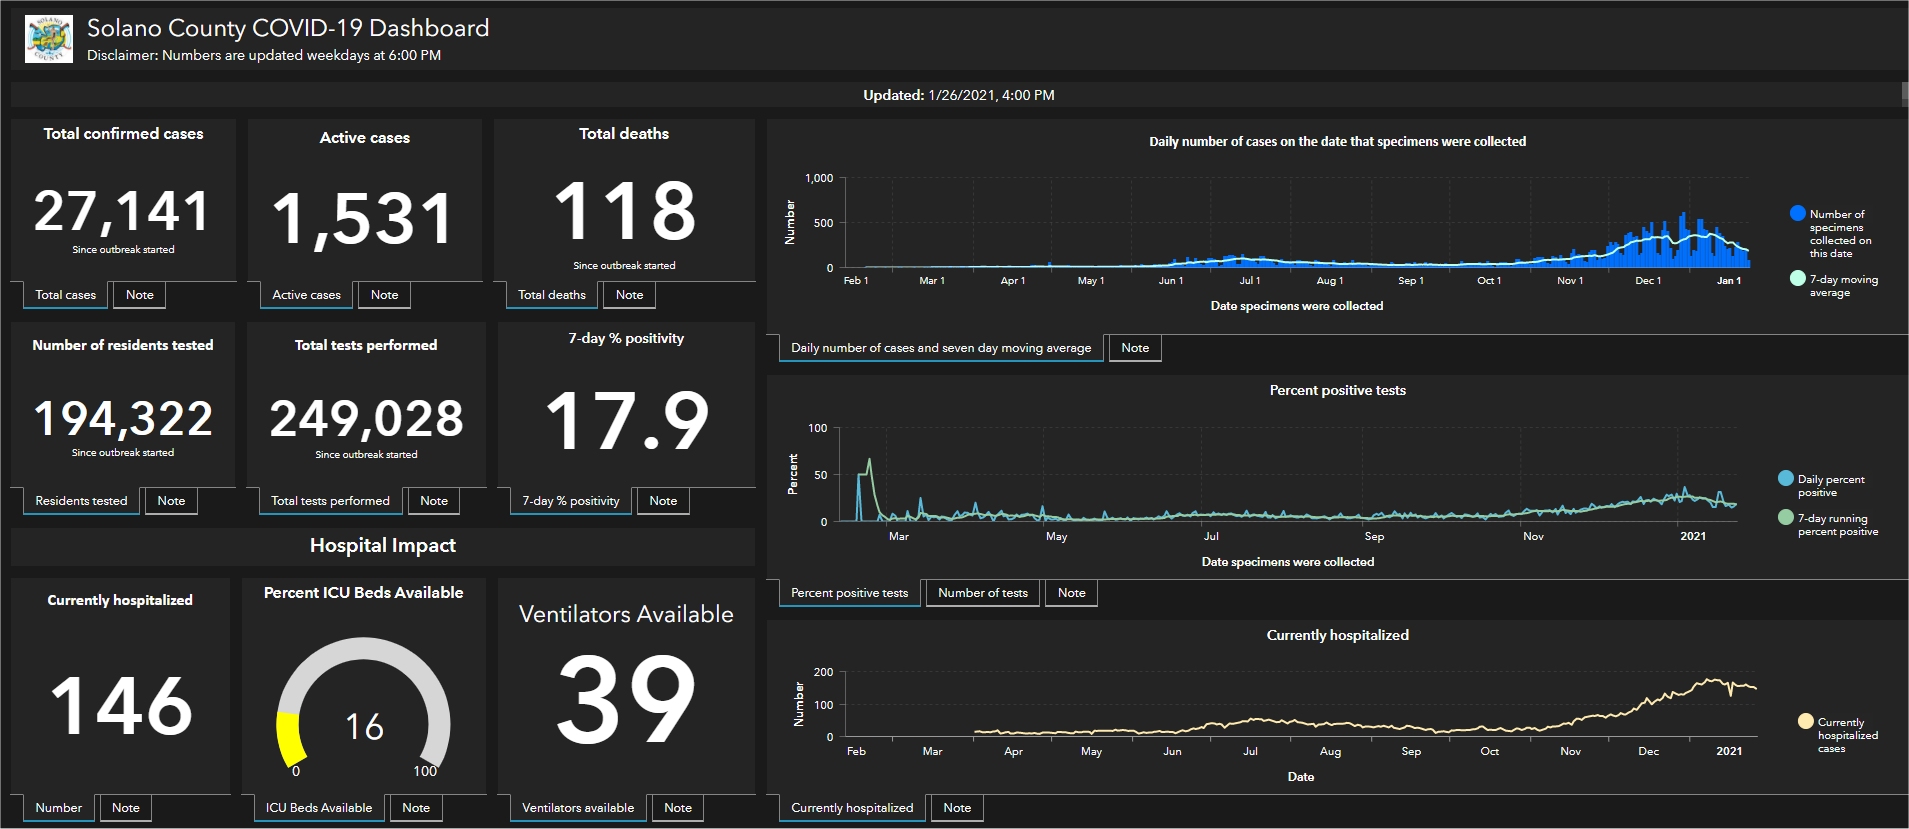
COMPARE: From the most recent report on Solano County’s COVID Dashboard, Friday, July 23:


The data on this page is from today’s and the previous Solano County COVID-19 Dashboard.  The Dashboard is full of much more information and updated weekdays around 4 or 5pm.  On the County’s dashboard, you can hover a mouse or click on an item for more information.  Note the tabs at top for “SummaryDemographics” and “Vaccines.”  Click here to go to today’s Solano County Dashboard.


Sources

States scale back virus reporting just as cases surge

[BenIndy Editor: Here in Solano County, our Public Health Department scaled back on virus reporting a month ago, on June 23.  Solano now updates its COVID-19 Dashboard only on Mon., Wed. and Fri..  Previously, the dashboard was updated 5 days a week M-F.  – R.S.]

In this Jan. 11, 2021 file photo, Nebraska Gov. Pete Rickets points to vaccination statistics during a news conference in Lincoln, Neb. Several states scaled back their reporting on COVID-19 in July 2021, just as cases across the country tripled with the delta variant of the virus spreading quickly among the unvaccinated. The shift to weekly instead of daily reporting in Florida, Nebraska, Iowa and South Dakota was also accompanied by less detail about the virus in Florida and Nebraska, and some officials described the move as part of a return to normal. (AP Photo/Nati Harnik, File)
Vallejo Times-Herald, By Josh Funk, The Associated Press, July 25, 2021

OMAHA,NEB.>> Several states scaled back their reporting of COVID-19 statistics this month just as cases across the country started to skyrocket, depriving the public of real-time information on outbreaks, cases, hospitalizations and deaths in their communities.

The shift to weekly instead of daily reporting in Florida, Nebraska, Iowa and South Dakota marked a notable shift during a pandemic in which coronavirus dashboards have become a staple for Americans closely tracking case counts and trends to navigate a crisis that has killed more than 600,000 people in the U.S.

In Nebraska, the state actually stopped reporting on the virus altogether for two weeks after Gov. Pete Ricketts declared an end to the official virus emergency, forcing news reporters to file public records requests or turn to national websites that track state data to learn about COVID statistics. The state backtracked two weeks later and came up with a weekly site that provides some basic numbers.

Other governments have gone the other direction and released more information, with Washington, D.C., this week adding a dashboard on breakthrough cases to show the number of residents who contracted the virus after getting vaccines. Many states have recently gone to reporting virus numbers only on weekdays.

When Florida changed the frequency of its virus reporting earlier this month, officials said it made sense given the decreasing number of cases and the increasing number of people being vaccinated.

Cases started soaring soon after, and Florida earlier this week made up up one-fifth of the country’s new coronavirus infections. As a result, Florida’s weekly releases — typically done on Friday afternoons — have consequences for the country’s understanding of the current summer surge, with no statewide COVID stats coming out of the virus hotspot for six days a week.

In Florida’s last two weekly reports, the number of new cases shot up from 23,000 to 45,000 and then 73,000 on Friday, an average of more than 10,000 day. Hospitals are starting to run out of space in parts of the state. With cases rising, Democrats and other critics have urged state officials and Gov. Ron DeSantis to resume daily outbreak updates.

“There was absolutely no reason to eliminate the daily updates beyond an effort to pretend like there are no updates,” said state Rep. Anna Eskamani, a Democrat from the Orlando area.

The trend of reducing data reporting has alarmed infectious disease specialists who believe that more information is better during a pandemic. People have come to rely on state virus dashboards to help make decisions about whether to attend large gatherings or wear masks in public, and understanding the level of risk in the community affects how people respond to virus restrictions and calls to get vaccinated.

“We know that showing the data to others actually is important because the actions that businesses take, the actions that schools take, the actions that civic leaders take, the actions that community leaders take, the actions that each of us individually take are all influenced by our perception of what the risk is out there,” said Dr. Kirsten Bibbins-Domingo, who leads the department of epidemiology and biostatistics at the University of California, San Francisco.


Associated Press Writer Bobby Caina Calvan contributed to this report.

Vaccination rate in Solano County? Dead last among Bay Area and nearby counties.

By Roger Straw, July 24, 2021

What is our vaccination rate and how do we compare with other California counties?

The numbers are always changing, of course.  And Solano County doesn’t report it on  their COVID Dashboard.  So I went digging.  Pretty interesting…

Los Angeles Times – Tracking coronavirus vaccinations in California

I went to latimes.com/projects/california-coronavirus-cases-tracking-outbreak/covid-19-vaccines-distribution/#county-comparison and scrolled down a bit to Vaccinations by county.

There you will see that as of 9:23am on July 24, among all Californians, 52.7% are fully vaccinated, meaning they have either received both shots of a two-dose regime from Pfizer or Moderna, or the single-dose Johnson & Johnson vaccine.

Solano County had administered 458,724 doses of vaccine.  58.4% of county residents had received at least one dose, but only 48.8% were fully vaccinated.

Our fully vaccinated rate of 48.8% puts us right around average, ranking 27th among California’s 58 counties.  Our one-dose measure ranks us a little better, 22nd out of 58 counties.

It’s interesting to compare Solano to our Bay Area neighbors: among the fully vaccinated, Solano ranks dead last among our 9 Bay Area and nearby neighbor counties.

Rank County Doses administered At least 1 dose Fully vaccinated
1 Marin 381,136 78.20% 72.20%
2 San Francisco 1,221,452 76.10% 69.60%
3 Santa Clara 2,655,770 74.50% 68.30%
4 San Mateo 1,045,079 73.80% 67.10%
5 Contra Costa 1,484,380 69.90% 65.10%
6 Alameda 2,127,975 70.80% 64.80%
7 Napa 178,871 69.50% 61.10%
8 Sonoma 621,710 67.00% 60.40%
9 Santa Cruz 328,312 65.50% 57.00%
10 Yolo 245,168 62.00% 55.10%
11 Sacramento 1,564,963 56.20% 50.00%
12 Solano 458,724 58.40% 48.80%

Only Sacramento County has fewer residents who have received only 1 dose.

And… vaccination rates by Solano cities and zip codes – Benicia at 80%!

I tracked down Benicia’s vaccination rate on the State of California’s Open Data Portal.  It’s complicated, and I can’t for the life of me figure out how I got there, but here’s the page you want: https://public.tableau.com/app/profile/ca.open.data/viz/LHJVaccineEquityPerformance/MapView.  This will open a map showing the instruction, “Click anywhere to load an interactive data experience.”  You click on the map and another map that looks identical opens.  But this map is interactive – click the + (plus sign) 2 or 3 times to enlarge the map, and then you can hover your mouse over our Solano cities and zips for detailed information.  Here’s what I found hovering over Benicia (click the image to enlarge).

In Benicia, zip code 94510, we have a vaccination rate among the 24,819 of us who are 12 years and older… of 80%!

You can explore the map to see your city’s zip code.  But I’ll save you a trip – here are the Solano cities/zips I was able to find AS OF TODAY.  Note that these numbers are all higher than the LA Times numbers above.  I suspect that is because this data calculates a percentage based on residents 12+ while the LA Times most likely uses total population.

Solano County zip code 12+ Population Share of population vaccinated
Benicia 94510 24,819 80%
Vallejo 94589 26,451 74%
Vallejo 94590 31,869 70%
Vallejo 94591 48,466 71%
Vallejo / Mare Island 94592 830 86%
Vallejo all zips 107,616 75%
Suisun City 94585 24,994 62%
Green Valley/Ffield 94534 33,547 80%
Fairfield 94533 62,858 61%
Travis AFB 94535 2,546 18%
Vacaville 95687 59,036 52%
Vacaville 95688 31,725 64%
Elmira 95625 74 100%
Dixon 95620 18,303 64%
Rio Vista 94571 10,004 71%

Something is surely off about the Travis numbers.  Is the Air Base not reporting?

Interesting that EVERYONE in Elmira is vaccinated!