
Solano County on Friday July 16: 169 new COVID infections over 2 days, active cases up by 122, percent positive test rate rises to 12%!
See: All about the DELTA VARIANT. Also, People with mild COVID can have long-term health problems. And: “More than 70% of COVID-19 patients studied report having at least one “long haul” symptom that lasts for months.” It’s not over yet! Please encourage everyone to get vaccinated!
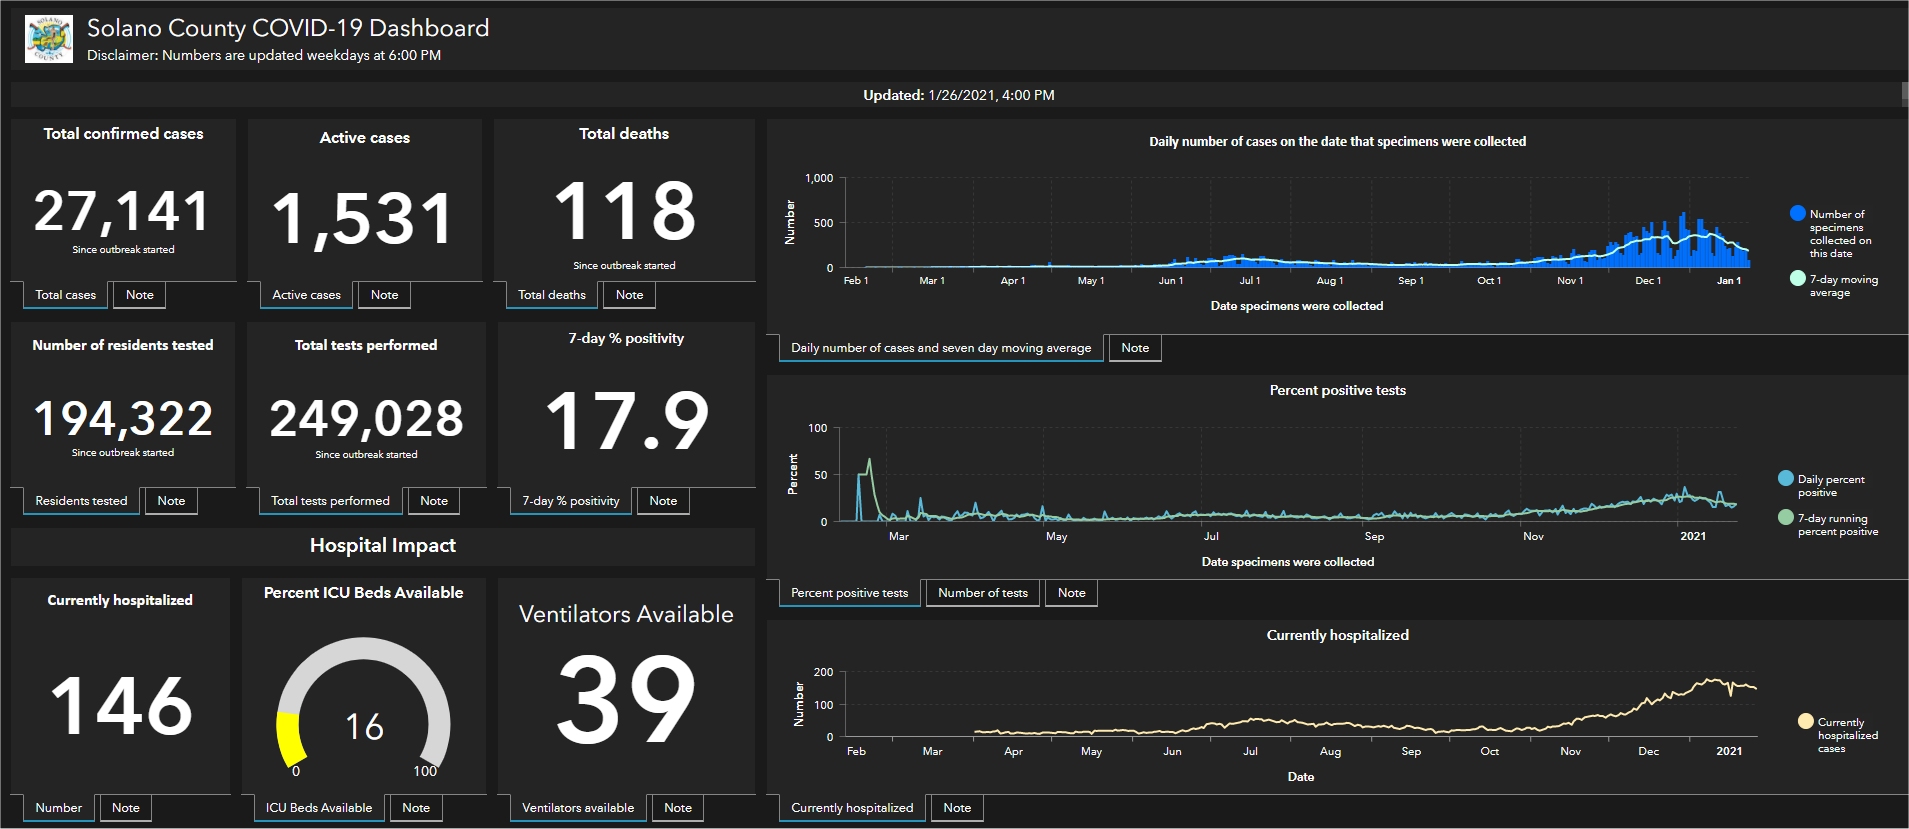
Solano County COVID dashboard SUMMARY:
[Sources: see below. See also my ARCHIVE spreadsheet of daily Solano COVID updates.]

Solano County reported 169 new COVID cases since Wednesday’s report, an average of 84 per day!! We have not seen single-day increases this high since early February. Note the trend: Solano County reported 1,288 new cases in April, an average of 43 per day. In May, Solano reported 920 new cases, an average of 30 per day. In June, we saw 751 new cases in Solano, an average of 23 new infections each day. In the first 16 days of July we have seen 657 new cases, or 41 per day.
Solano’s 449 ACTIVE cases today is our highest since February 19 and has risen daily over the last week: Wednesday 327 cases, Monday 289 cases, and last Friday 264 cases.

Our percent positivity rate was up to 12% today, from Wednesday’s 10.2%, Monday’s 9.2% and Friday’s 8.9%. We would be back in the PURPLE TIER with rates this high. Although Solano County does not report hospitalization data in timely fashion, it is noteworthy that availability of ICU beds is at 38%, continuing this week at levels not seen since March and April. COVID is definitely still out there! Some California counties are returning to mandatory masks for all in crowded places – that’s my personal plan even though I’m vaccinated, and I’d recommend it for you, too.
Solano County reported no new deaths today. The County total is now 245 deaths since the pandemic began.
Hospitalizations on Friday, July 16:
Solano County reported an intake/discharge total of 19 CURRENTLY hospitalized persons with COVID today, unchanged since Wednesday. The County updates the total of CURRENTLY hospitalized cases with every report, but never reports on the cumulative total of hospitalized COVID patients over the course of the pandemic. That total must be independently discovered in the County’s occasional update on the demographic chart labeled “Hospitalizations by Age Group.” That chart was not updated today and remains at a total of 1,307 persons hospitalized since the beginning of the outbreak, in the following age groups:
| Age Group | Hospitalizations | % of Total |
| 0-17 | 27 | 2% |
| 18-49 | 327 | 25% |
| 50-64 | 341 | 26% |
| 65+ | 612 | 47% |
| TOTAL | 1,307 | 100% |
Hospitalizations are also recorded on the County’s demographic chart labeled “Hospitalizations by Race / Ethnicity.” The chart was not updated today. Here are the current numbers. Interestingly, the total doesn’t square with totals by age groups.
| Race / Ethnicity | Hospitalizations | % of Total |
| Asians | 184 | 15% |
| Black / African American | 199 | 16% |
| Hispanic / Latinx | 327 | 27% |
| White | 406 | 34% |
| Multirace / Others | 85 | 7% |
| TOTAL | 1,201 | 99% |
Cases by City on Friday, July 16:

- Benicia added 8 new cases today, a total of 1,056 cases since the outbreak began, 3.8% of its population of 27,570.
- Dixon added 10 new case today, total of 1,969 cases, 9.9% of its population of 19,794.
- Fairfield added 42 new cases today, total of 9,365 cases, 8.0% of its population of 117,149.
- Rio Vista remained steady today, total of 408 cases, 4.3% of its population of 9,416.
- Suisun City added 22 new cases today, total of 2,398 cases, 8.1% of its population of 29,447.
- Vacaville added 43 new cases today, a total of 9,105 cases, 9.2% its of population of 98,807.
- Vallejo added 40 new cases today, a total of 10,222 cases, 8.6% of its population of 119,544 (up from 8.5%).
- Unincorporated areas added 3 new cases today (the area’s first new cases since May 8!), total of 106 cases (population figures not available).
COMPARE: From the most recent report on Solano County’s COVID Dashboard, Wednesday, July 14:


The data on this page is from today’s and the previous Solano County COVID-19 Dashboard. The Dashboard is full of much more information and updated weekdays around 4 or 5pm. On the County’s dashboard, you can hover a mouse or click on an item for more information. Note the tabs at top for “Summary, Demographics” and “Vaccines.” Click here to go to today’s Solano County Dashboard.[sta_anchor id=”sources” /]
Sources
- Solano County Coronavirus Dashboard (posted on the County website today).
- See also my ARCHIVE of daily Solano COVID updates (an excel spreadsheet).


You must be logged in to post a comment.